
K-means Clustering
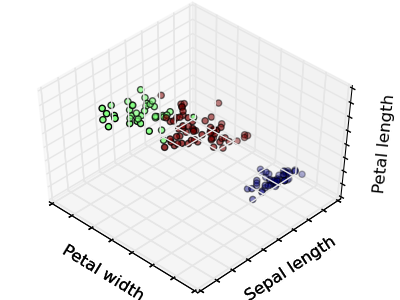
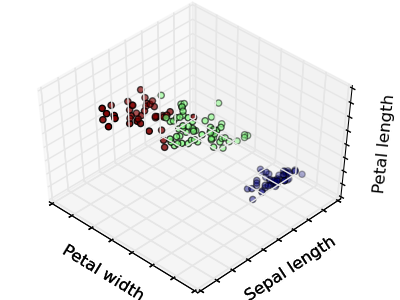
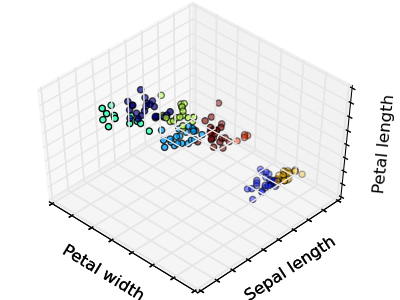
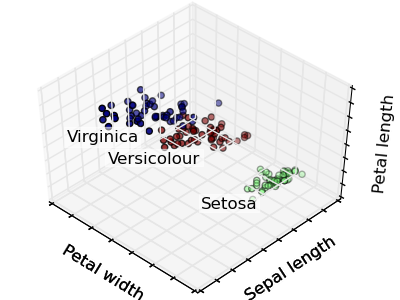
The plots display firstly what a K-means algorithm would yield using three clusters. It is then shown what the effect of a bad initialization is on the classification process: By setting n_init to only 1 (default is 10), the amount of times that the algorithm will be run with different centroid seeds is reduced. The next plot displays what using eight clusters would deliver and finally the ground truth.
Python source code: plot_cluster_iris.py
print(__doc__)


# Code source: Gael Varoqueux
# Modified for Documentation merge by Jaques Grobler
# License: BSD 3 clause

import numpy as np
import pylab as pl
from mpl_toolkits.mplot3d import Axes3D


from sklearn.cluster import KMeans
from sklearn import datasets

np.random.seed(5)

centers = [[1, 1], [-1, -1], [1, -1]]
iris = datasets.load_iris()
X = iris.data
y = iris.target

estimators = {'k_means_iris_3': KMeans(n_clusters=3),
              'k_means_iris_8': KMeans(n_clusters=8),
              'k_means_iris_bad_init': KMeans(n_clusters=3, n_init=1,
                                              init='random')}


fignum = 1
for name, est in estimators.iteritems():
    fig = pl.figure(fignum, figsize=(4, 3))
    pl.clf()
    ax = Axes3D(fig, rect=[0, 0, .95, 1], elev=48, azim=134)

    pl.cla()
    est.fit(X)
    labels = est.labels_

    ax.scatter(X[:, 3], X[:, 0], X[:, 2], c=labels.astype(np.float))

    ax.w_xaxis.set_ticklabels([])
    ax.w_yaxis.set_ticklabels([])
    ax.w_zaxis.set_ticklabels([])
    ax.set_xlabel('Petal width')
    ax.set_ylabel('Sepal length')
    ax.set_zlabel('Petal length')
    fignum = fignum + 1

# Plot the ground truth
fig = pl.figure(fignum, figsize=(4, 3))
pl.clf()
ax = Axes3D(fig, rect=[0, 0, .95, 1], elev=48, azim=134)

pl.cla()

for name, label in [('Setosa', 0),
                    ('Versicolour', 1),
                    ('Virginica', 2)]:
    ax.text3D(X[y == label, 3].mean(),
              X[y == label, 0].mean() + 1.5,
              X[y == label, 2].mean(), name,
              horizontalalignment='center',
              bbox=dict(alpha=.5, edgecolor='w', facecolor='w'))
# Reorder the labels to have colors matching the cluster results
y = np.choose(y, [1, 2, 0]).astype(np.float)
ax.scatter(X[:, 3], X[:, 0], X[:, 2], c=y)

ax.w_xaxis.set_ticklabels([])
ax.w_yaxis.set_ticklabels([])
ax.w_zaxis.set_ticklabels([])
ax.set_xlabel('Petal width')
ax.set_ylabel('Sepal length')
ax.set_zlabel('Petal length')
pl.show()
Total running time of the example: 0.30 seconds