
| k-Wave Toolbox |
 
|
Create a binary map of filled ball within a 3D grid
ball = makeBall(Nx, Ny, Nz, cx, cy, cz, radius)
ball = makeBall(Nx, Ny, Nz, cx, cy, cz, radius, plot_ball)
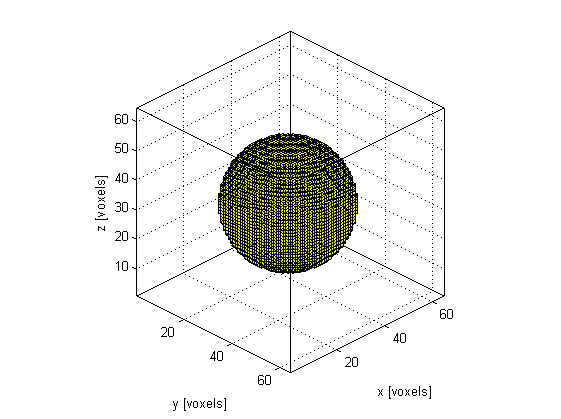
makeBall creates a binary map of a filled ball within a three-dimensional grid (the ball position is denoted by 1's in the matrix with 0's elsewhere). A single grid point is taken as the disc centre thus the total diameter of the ball will always be an odd number of grid points. The plot that is displayed after calling makeBall(64, 64, 64, 32, 32, 32, 20, true) is given below.

|
size of the 3D grid [grid points] |
|
centre of the ball [grid points] |
|
ball radius [grid points] |
|
Boolean controlling whether the ball is plotted using |
|
3D binary map of a filled ball |
makeCircle, makeDisc, makeSphere
 |
logCompression | makeCartCircle |  |
© 2009-2014 Bradley Treeby and Ben Cox.