Labels
This page aims to explain how to customize R treemaps. Make sure you already understood how to build a basic treemap with R.
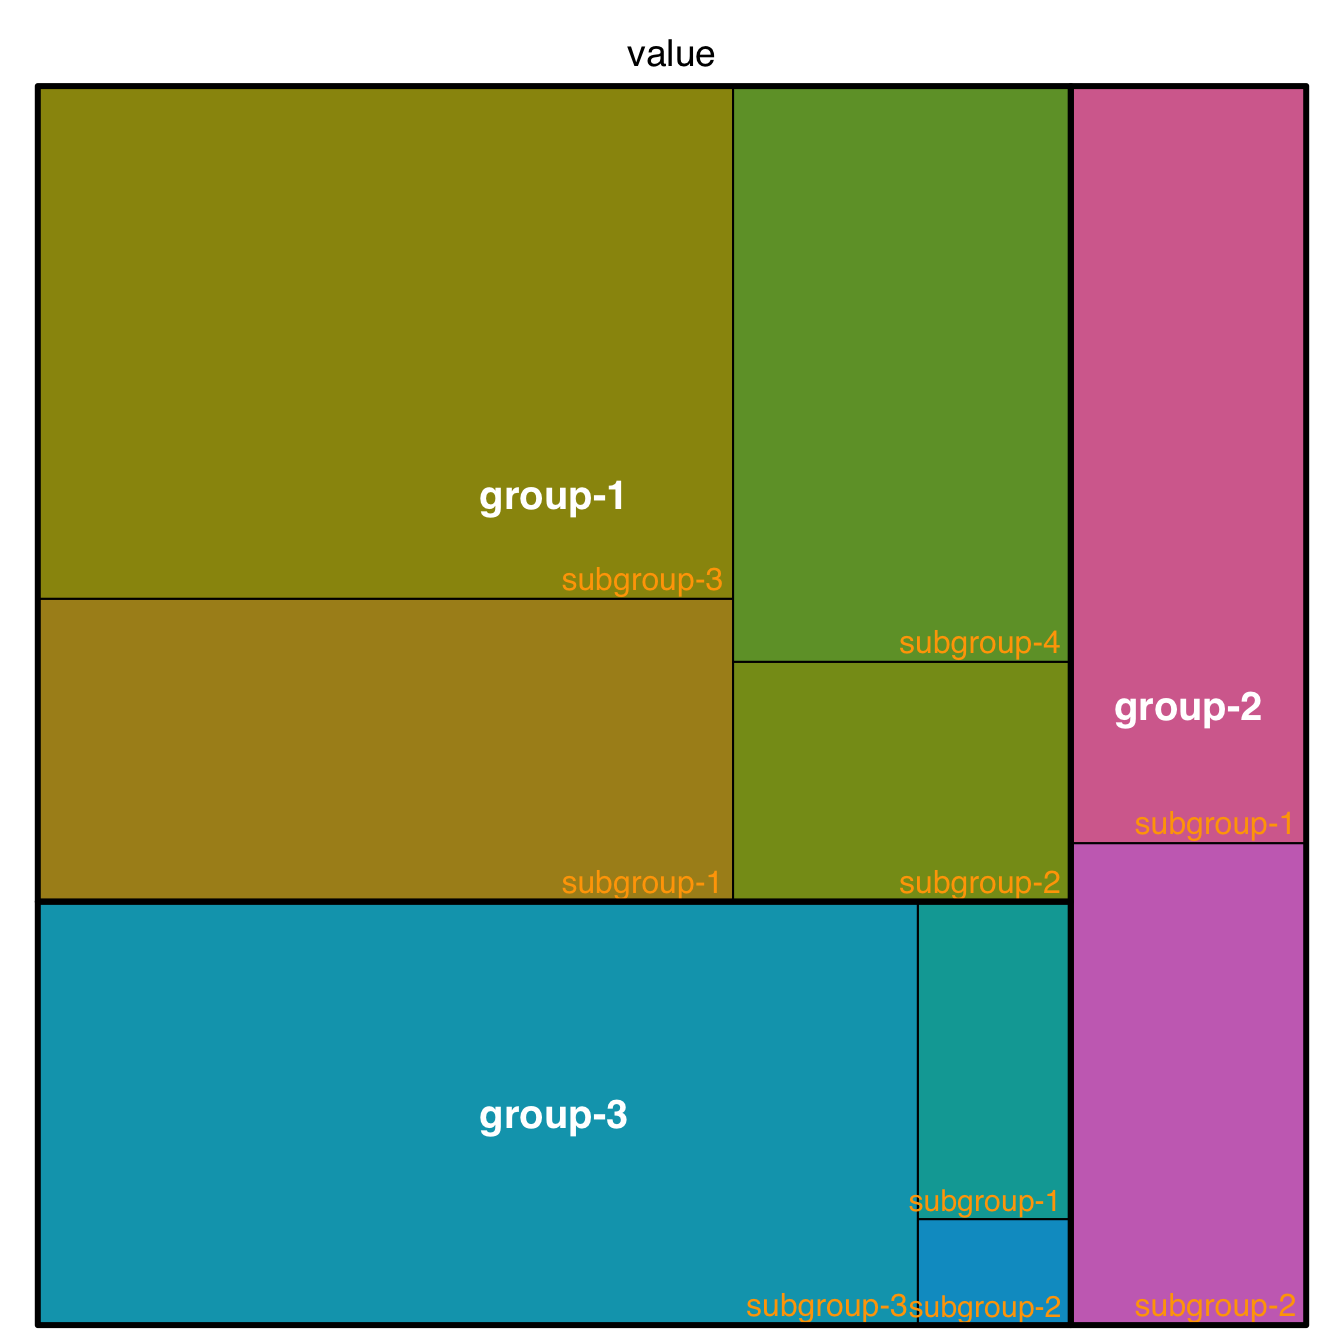
The first step is to control label appearance. All the options are explained in the code below. Note that you can apply a different feature to each level of the treemap, for example using white for group labels, and orange for subgroup labels.
# library
library(treemap)

# Create data
group <- c(rep("group-1",4),rep("group-2",2),rep("group-3",3))
subgroup <- paste("subgroup" , c(1,2,3,4,1,2,1,2,3), sep="-")
value <- c(13,5,22,12,11,7,3,1,23)
data <- data.frame(group,subgroup,value)

# Custom labels:
treemap(data, index=c("group","subgroup"),     vSize="value", type="index",

    fontsize.labels=c(15,12),                # size of labels. Give the size per level of aggregation: size for group, size for subgroup, sub-subgroups...
    fontcolor.labels=c("white","orange"),    # Color of labels
    fontface.labels=c(2,1),                  # Font of labels: 1,2,3,4 for normal, bold, italic, bold-italic...
    bg.labels=c("transparent"),              # Background color of labels
    align.labels=list(
        c("center", "center"),
        c("right", "bottom")
        ),                                   # Where to place labels in the rectangle?
    overlap.labels=0.5,                      # number between 0 and 1 that determines the tolerance of the overlap between labels. 0 means that labels of lower levels are not printed if higher level labels overlap, 1  means that labels are always printed. In-between values, for instance the default value .5, means that lower level labels are printed if other labels do not overlap with more than .5  times their area size.
    inflate.labels=F,                        # If true, labels are bigger when rectangle is bigger.

)
Borders
You can control the border:
- color with
border.col - width with
border.lwds
Remember that you can still provide a vector to each option: it gives the value for groups, subgroups and so on.
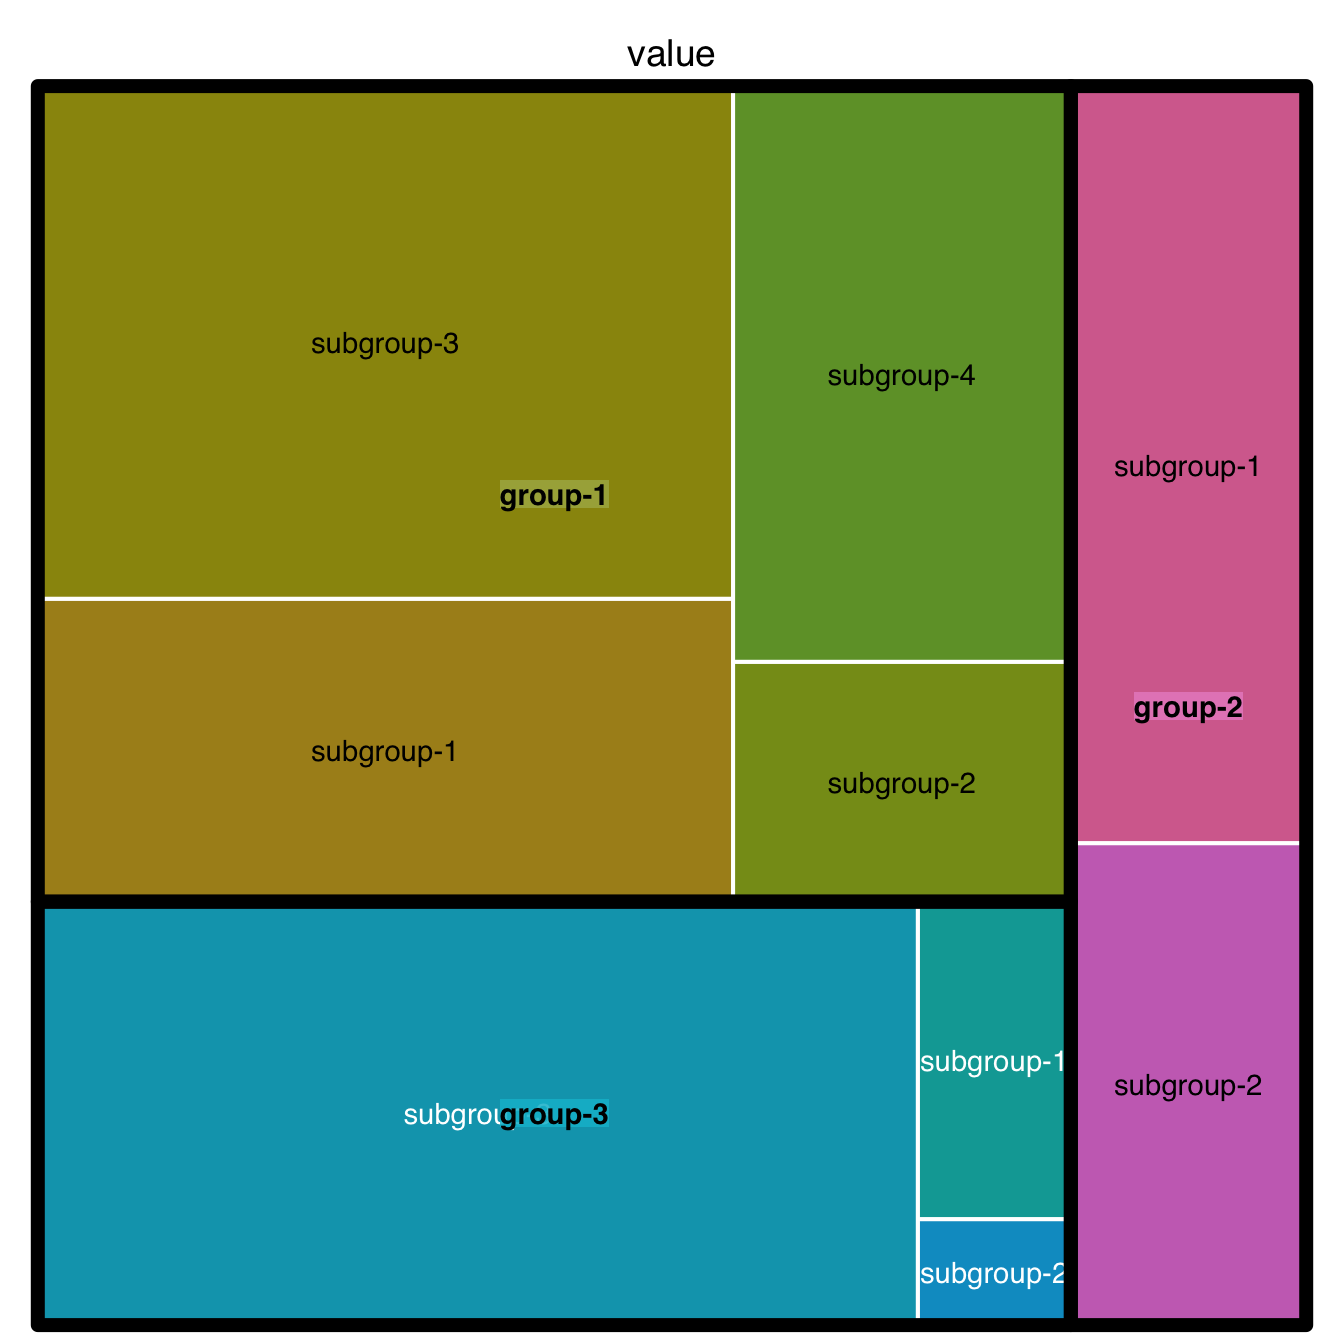
# Custom borders:
treemap(data, index=c("group","subgroup"), vSize="value", type="index",

    border.col=c("black","white"),             # Color of borders of groups, of subgroups, of subsubgroups ....
    border.lwds=c(7,2)                         # Width of colors

    )
General features
A few other arguments for more general customization. The palette arguments accepts any palette from RColorBrewer.
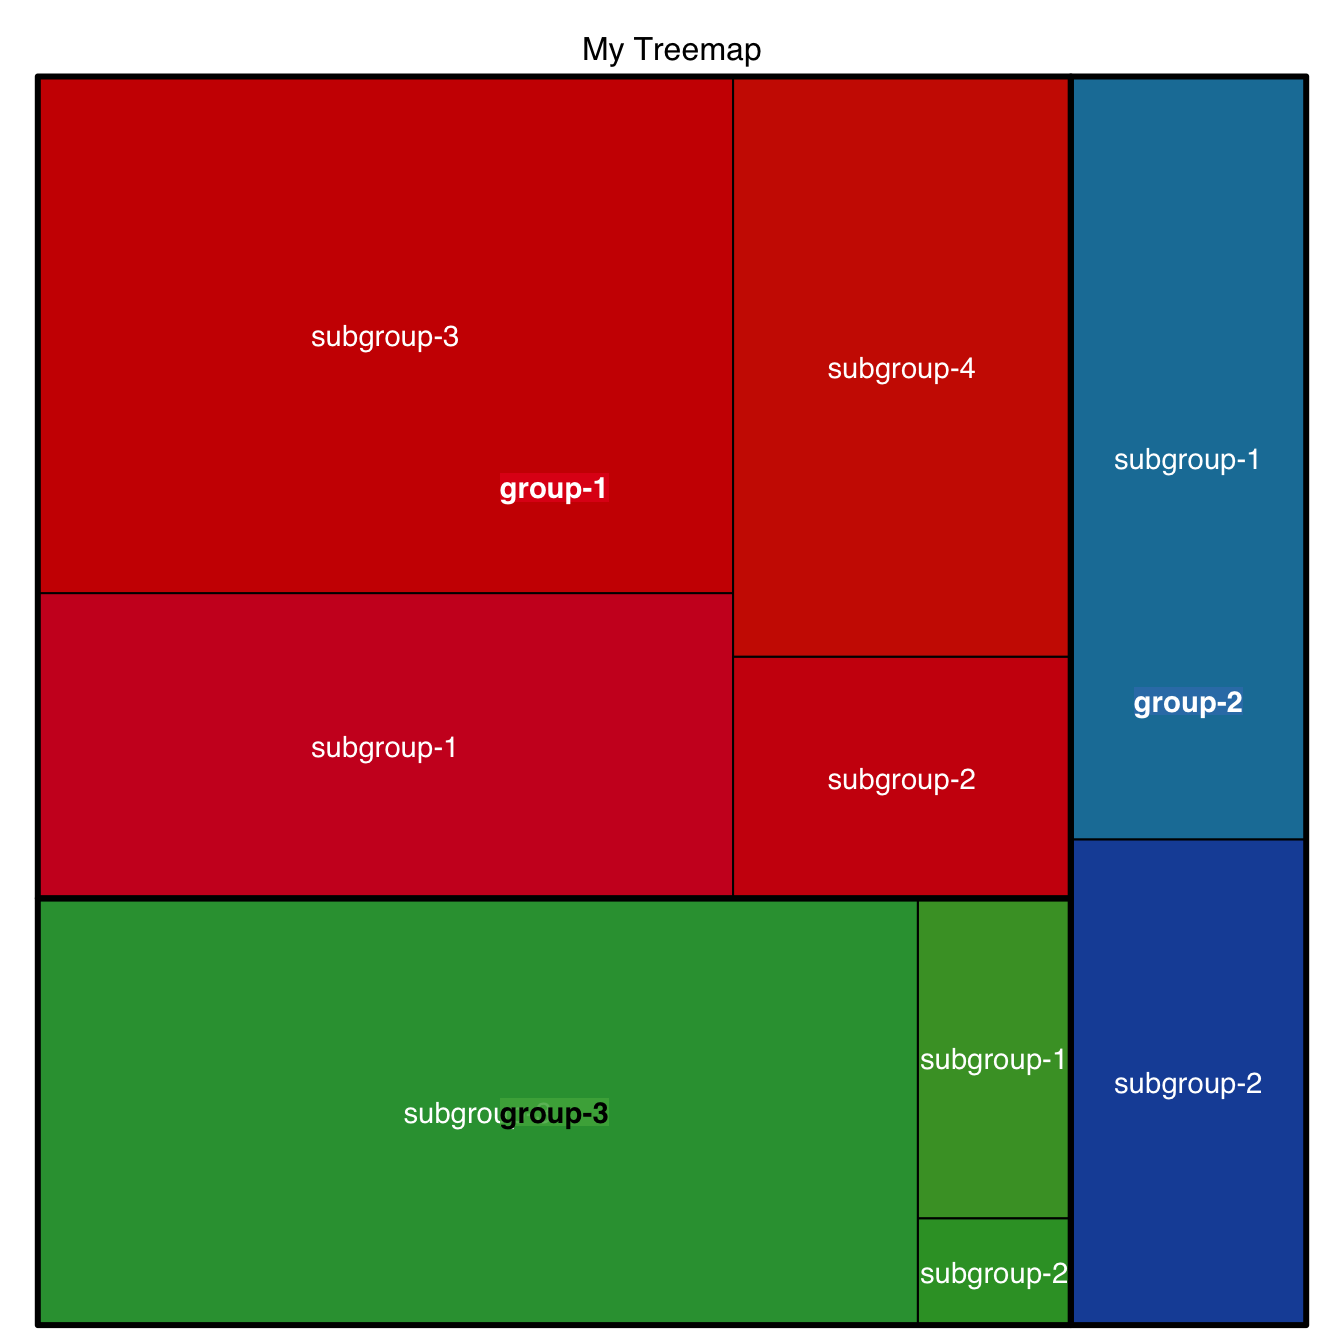
# General features:
treemap(data, index=c("group","subgroup"), vSize="value",

    type="index",                            # How you color the treemap. type help(treemap) for more info
    palette = "Set1",                        # Select your color palette from the RColorBrewer presets or make your own.
    title="My Treemap",                      # Customize your title
    fontsize.title=12,                       # Size of the title

)