Two types of dendrogram
Building dendrogram with d3.js requires to have an input at the Json format, like here. The d3r package makes it a breeze to get this format from a R data frame.
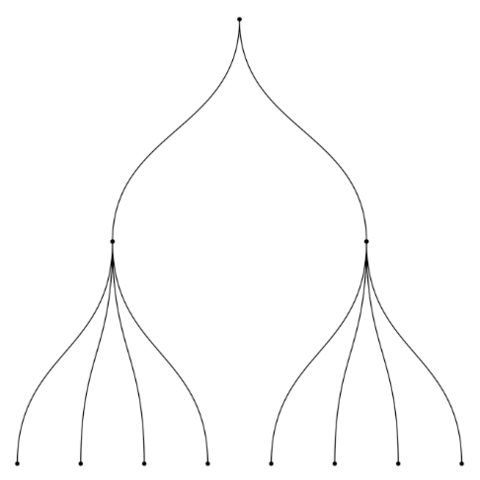
Dendrogram from
hierarchical data.The ggraph package is the best option to build a dendrogram from hierarchical data with R. It is based on the grammar of graphic and thus follows the same logic that ggplot2.
The collapsibletree package is an htmlwidget: it automatically builds collapsible interactive tree diagram. On the chart below, click a node to reveal the next branch, and zoom in/out if necessary.