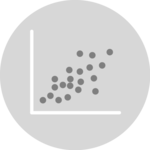
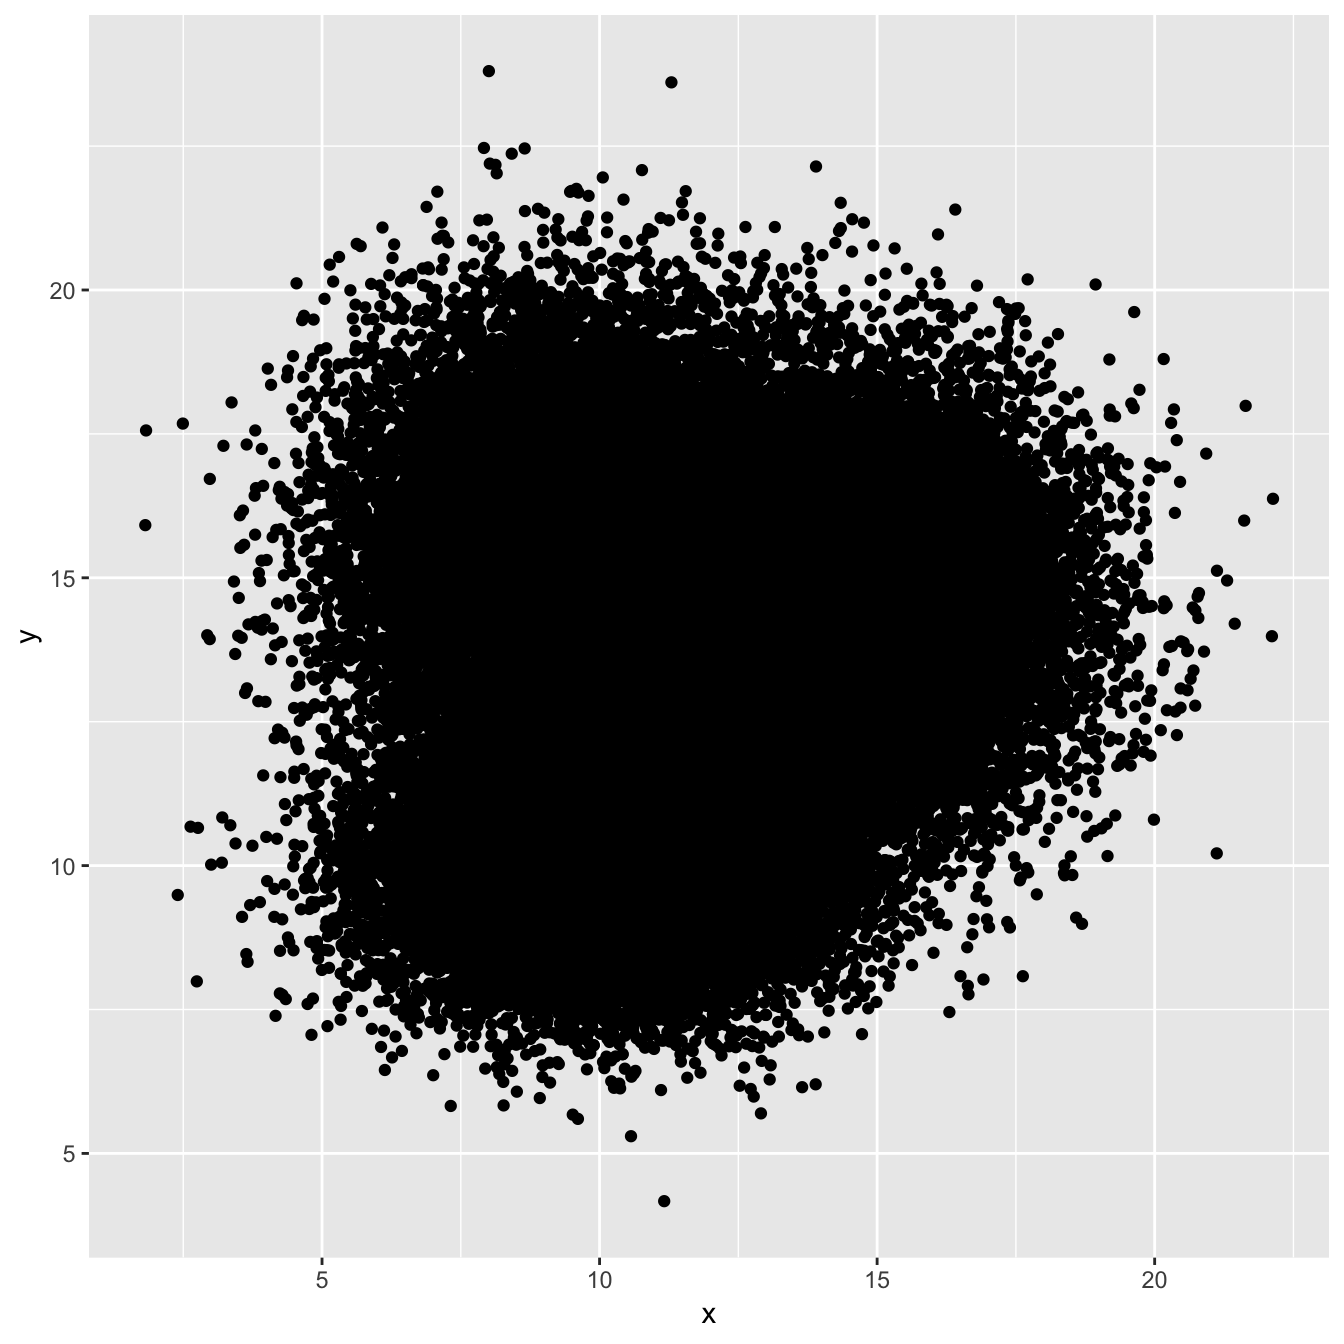
The issue with geom_point()
A 2d density plot is useful to study the relationship between 2 numeric variables if you have a huge number of points.
To avoid overlapping (as in the scatterplot beside), it divides the plot area in a multitude of small fragment and represents the number of points in this fragment.
There are several types of 2d density plots. Each has its proper ggplot2 function. This post describes all of them.
# Library
library(tidyverse)

# Data
a <- data.frame( x=rnorm(20000, 10, 1.9), y=rnorm(20000, 10, 1.2) )
b <- data.frame( x=rnorm(20000, 14.5, 1.9), y=rnorm(20000, 14.5, 1.9) )
c <- data.frame( x=rnorm(20000, 9.5, 1.9), y=rnorm(20000, 15.5, 1.9) )
data <- rbind(a,b,c)


# Basic scatterplot
ggplot(data, aes(x=x, y=y) ) +
  geom_point()
2d Histogram with geom_bin2d()
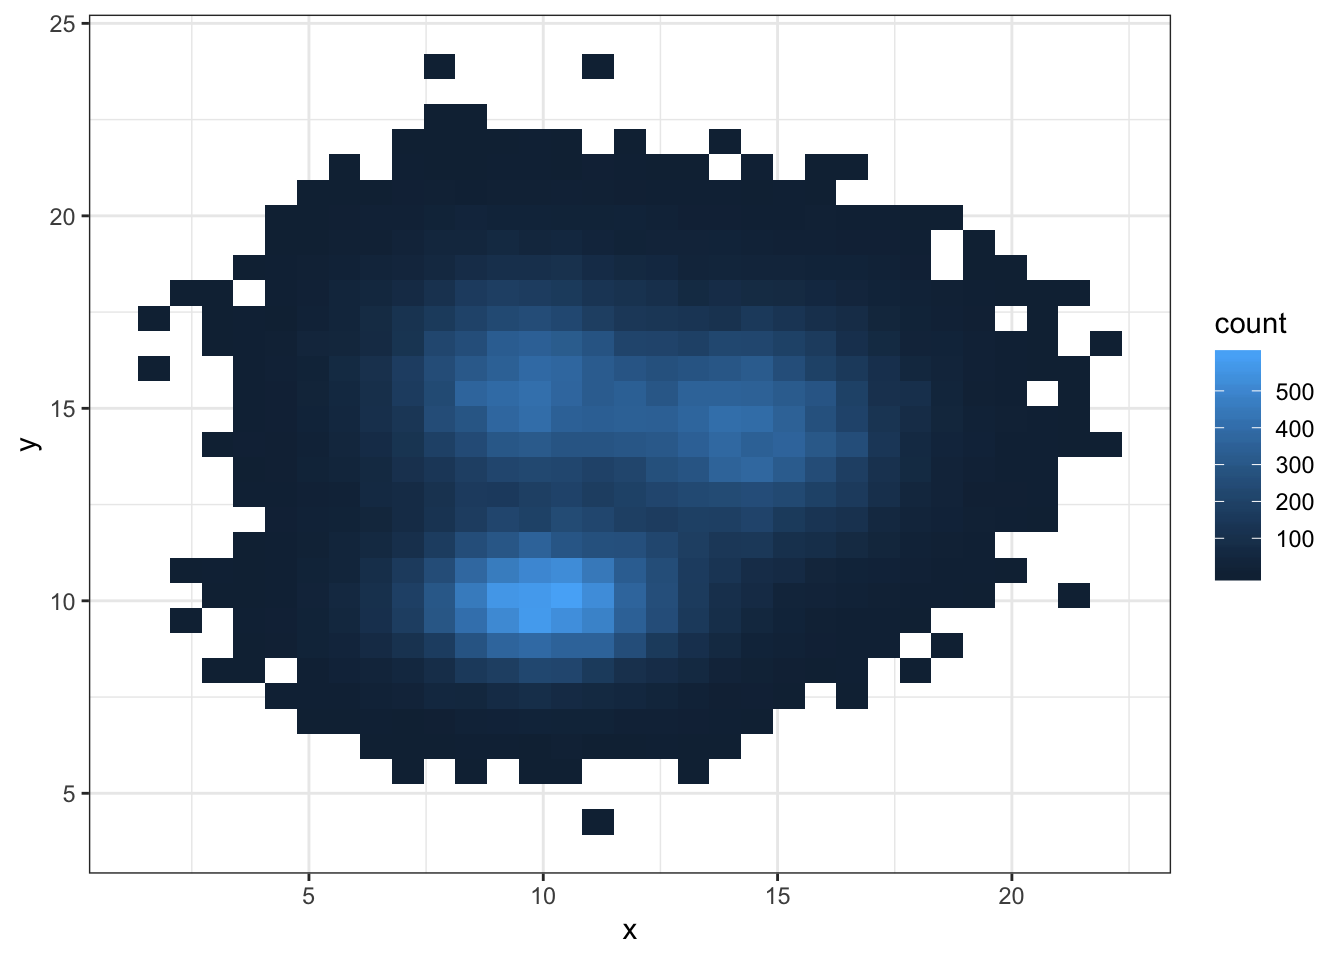
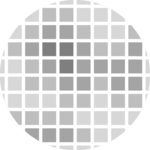
For 2d histogram, the plot area is divided in a multitude of squares. (It is a 2d version of the classic histogram). It is called using the geom_bin_2d() function. This function offers a bins argument that controls the number of bins you want to display.
Note: If you’re not convinced about the importance of the bins option, read this.
# 2d histogram with default option
ggplot(data, aes(x=x, y=y) ) +
geom_bin2d() +
theme_bw()
# Bin size control + color palette
ggplot(data, aes(x=x, y=y) ) +
geom_bin2d(bins = 70) +
scale_fill_continuous(type = "viridis") +
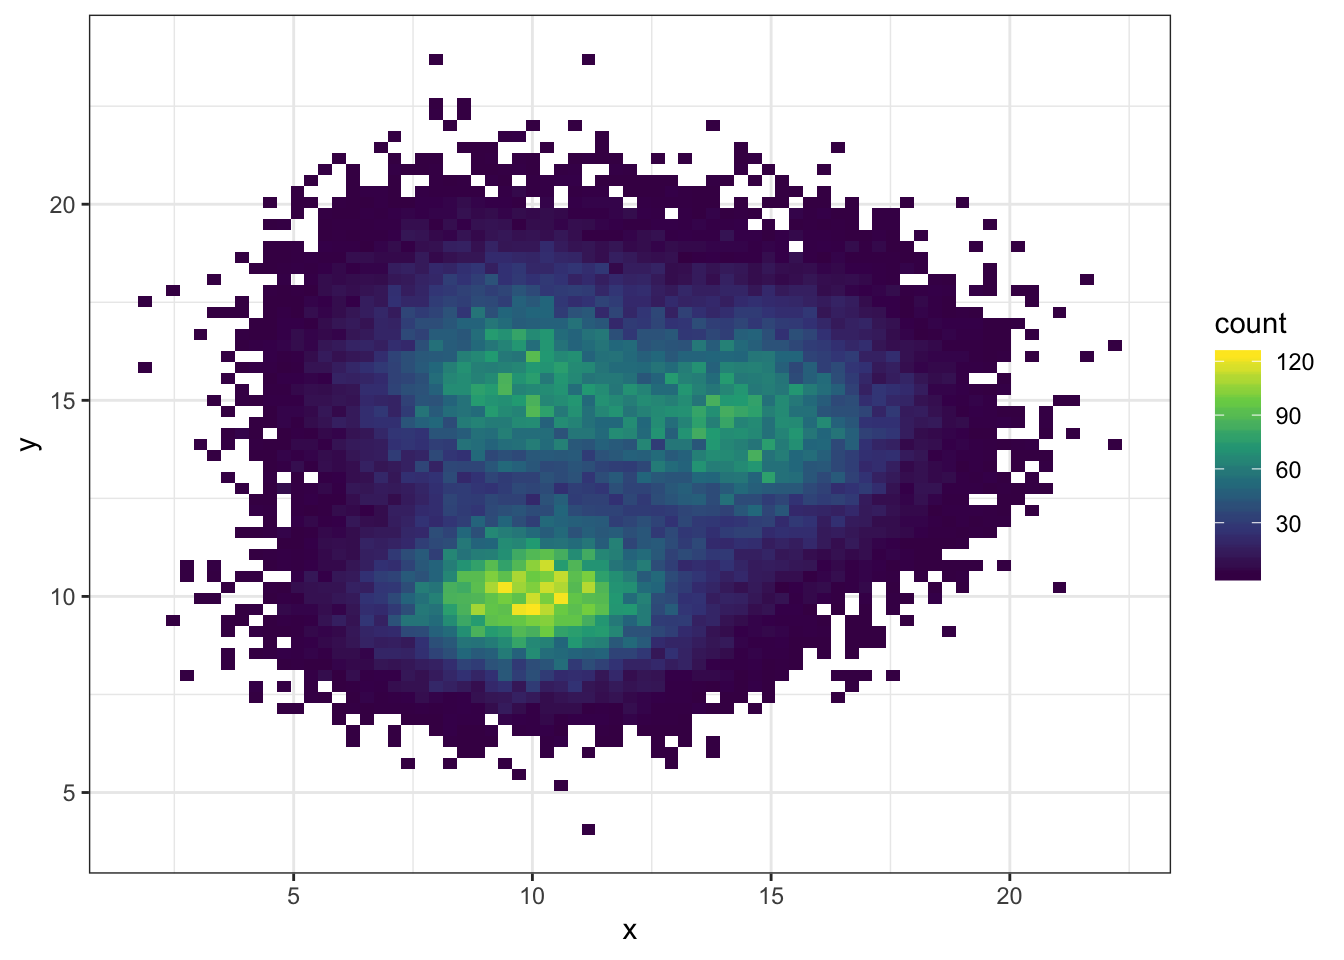
theme_bw()Hexbin chart with geom_hex()
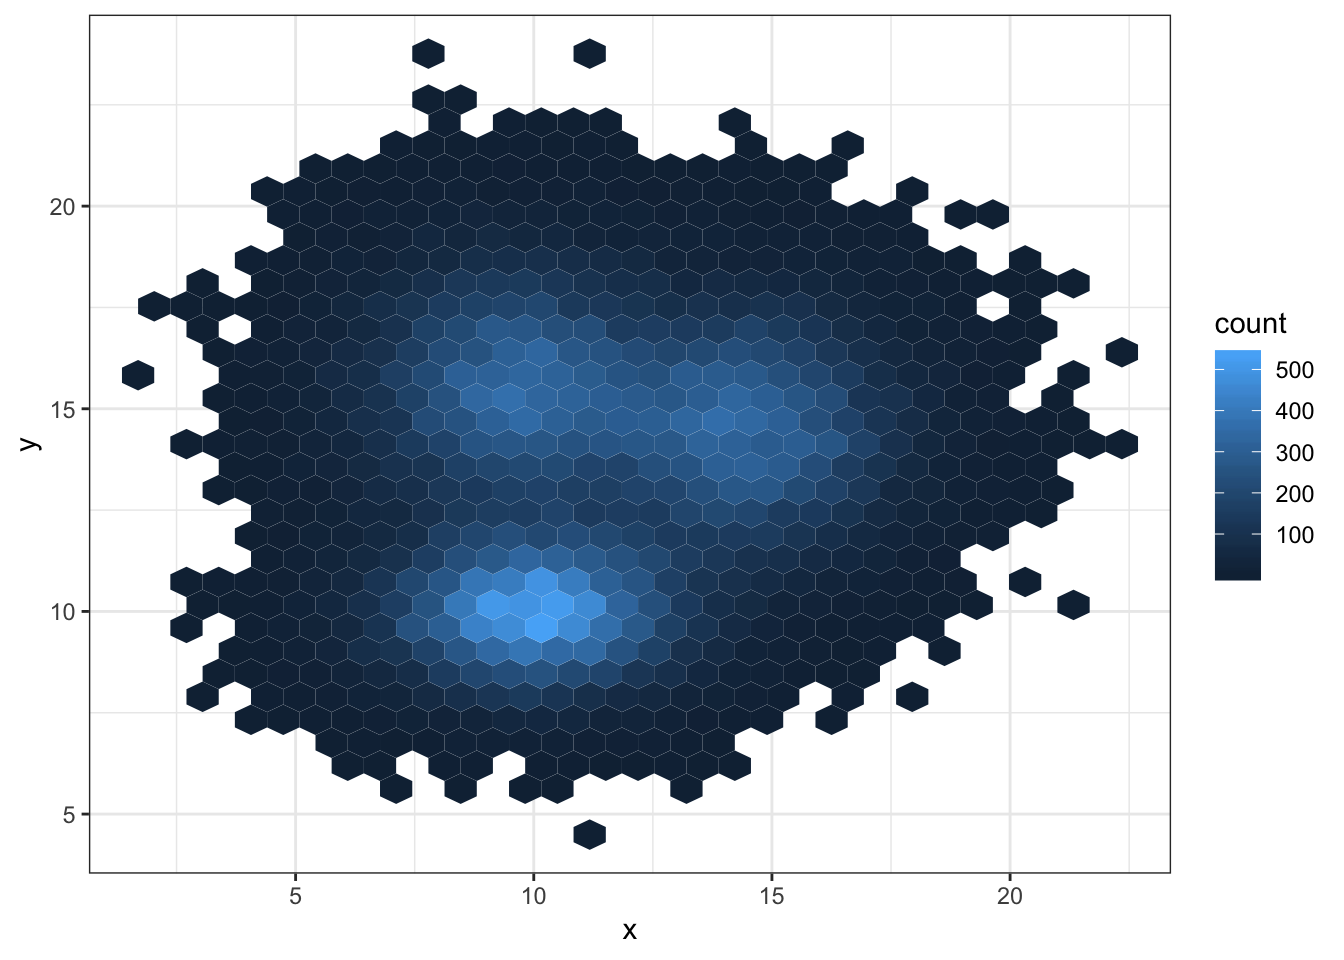
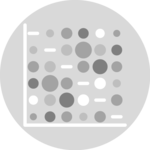
Another alternative is to divide the plot area in a multitude of hexagons: it is thus called a hexbin chart, and is made using the geom_hex() function.
This function provides the bins argument as well, to control the number of division per axis.
# Hexbin chart with default option
ggplot(data, aes(x=x, y=y) ) +
geom_hex() +
theme_bw()
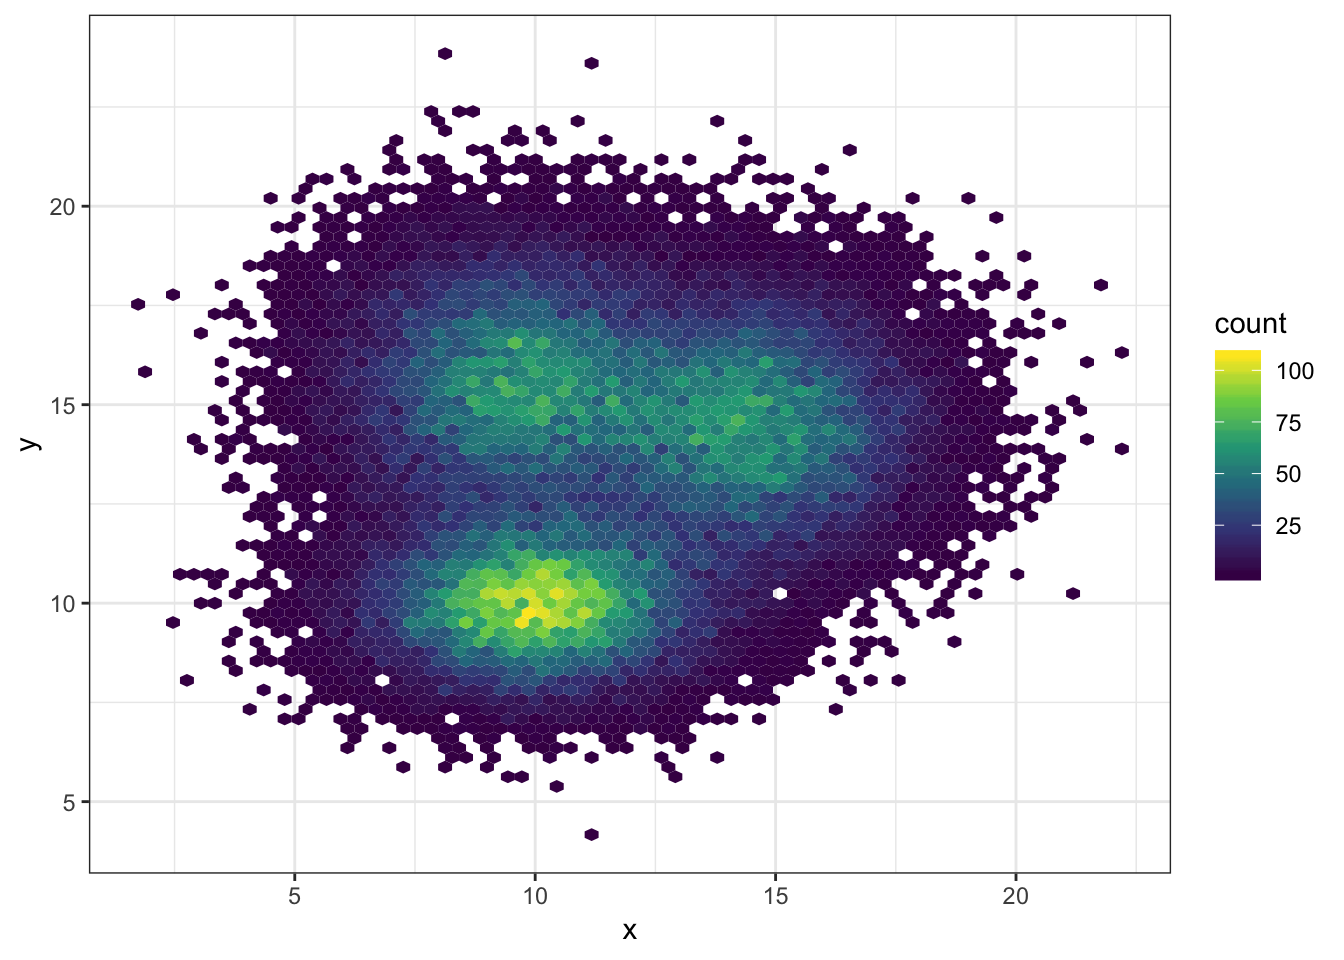
# Bin size control + color palette
ggplot(data, aes(x=x, y=y) ) +
geom_hex(bins = 70) +
scale_fill_continuous(type = "viridis") +
theme_bw()2d distribution with geom_density_2d or stat_density_2d
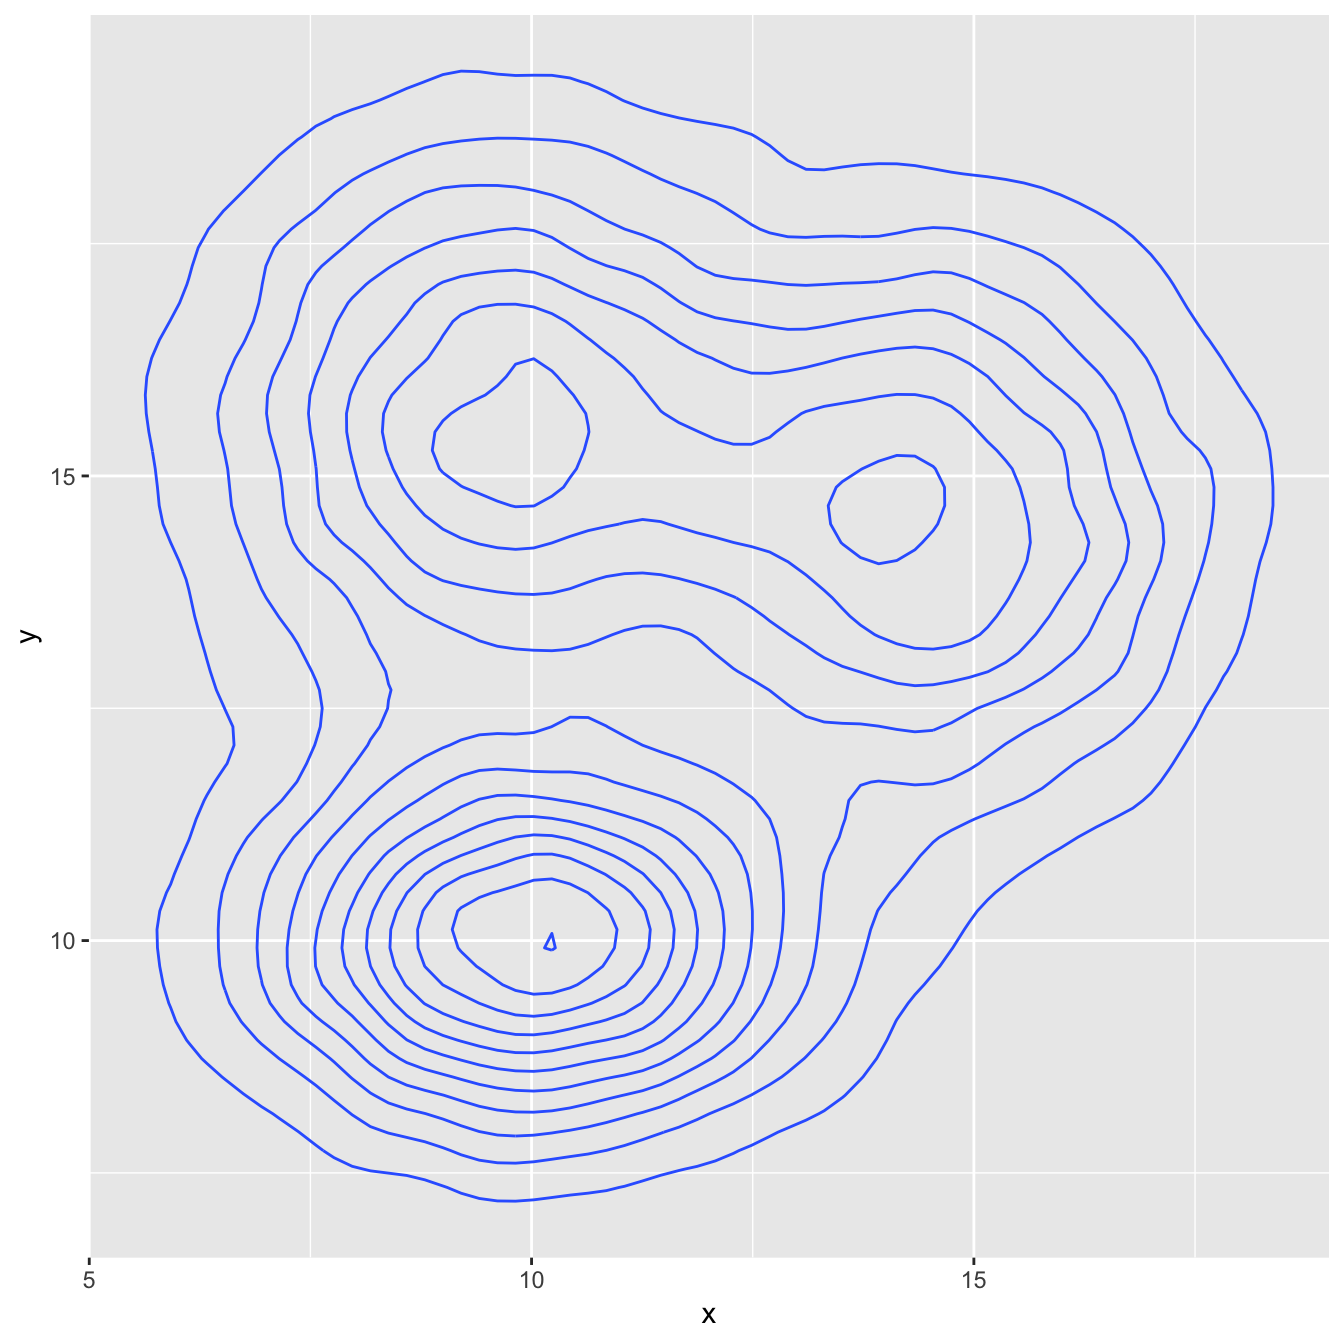

As you can plot a density chart instead of a histogram, it is possible to compute a 2d density and represent it. Several possibilities are offered by ggplot2: you can show the contour of the distribution, or the area, or use the raster function:
# Show the contour only
ggplot(data, aes(x=x, y=y) ) +
geom_density_2d()
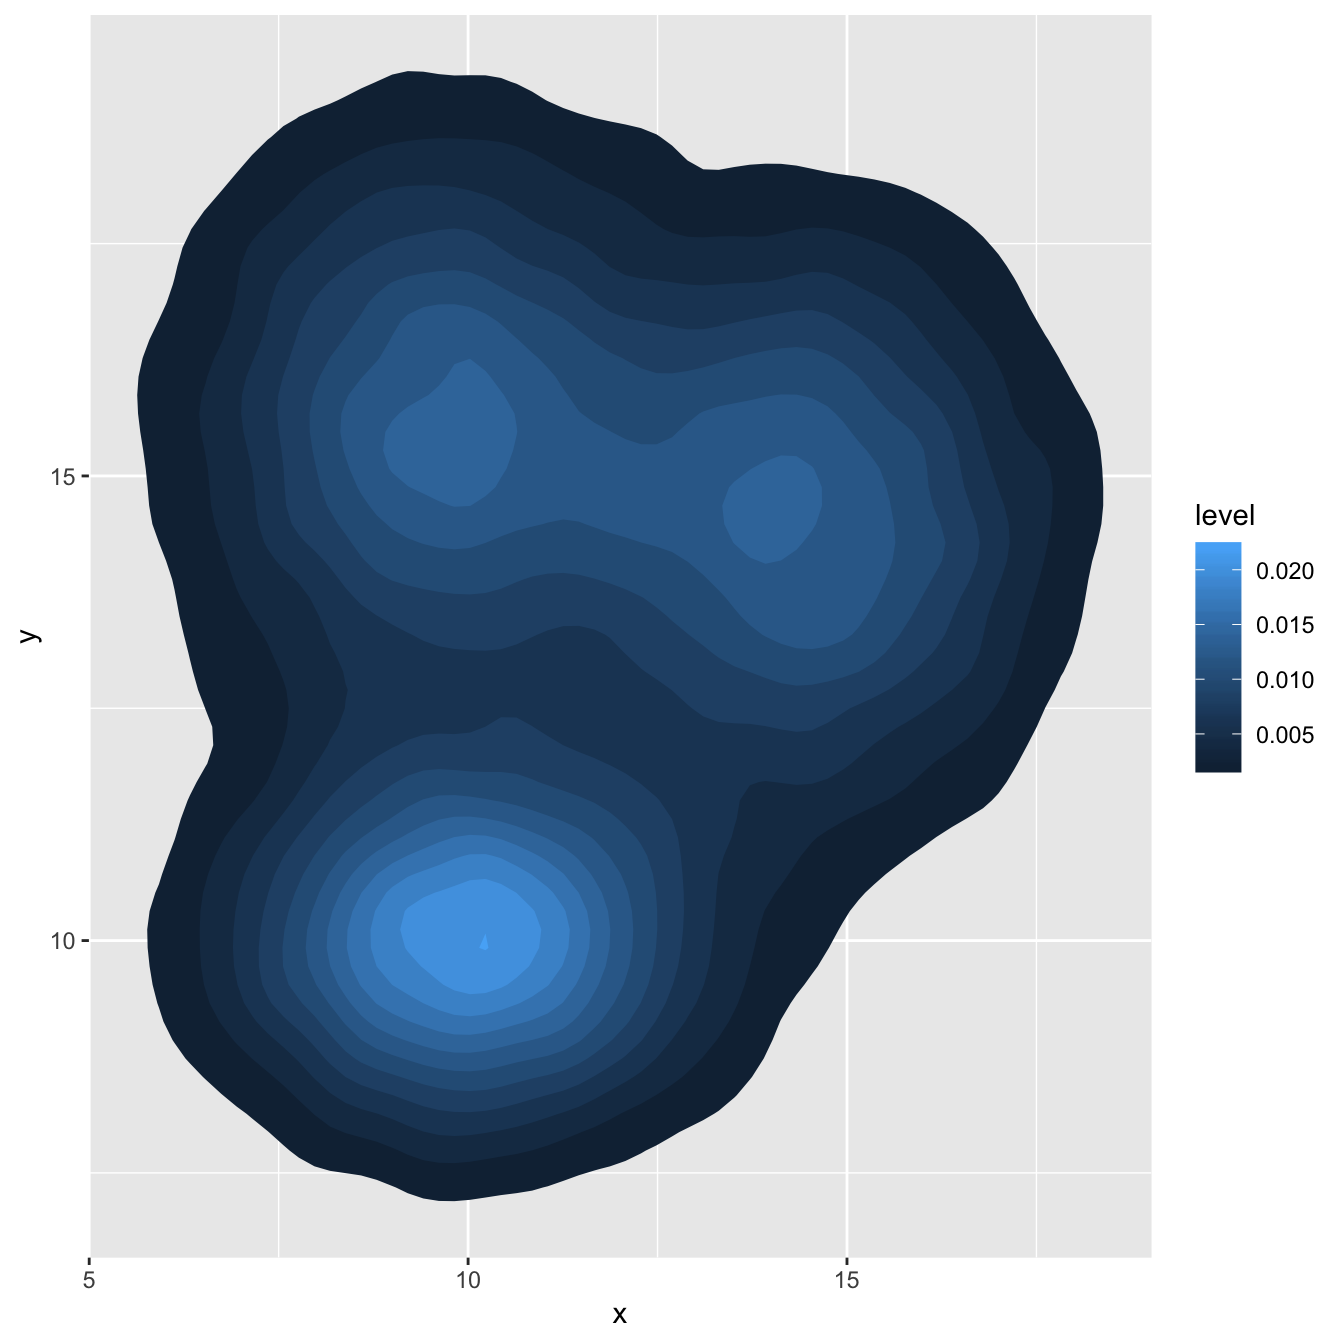
# Show the area only
ggplot(data, aes(x=x, y=y) ) +
stat_density_2d(aes(fill = ..level..), geom = "polygon")
# Area + contour
ggplot(data, aes(x=x, y=y) ) +
stat_density_2d(aes(fill = ..level..), geom = "polygon", colour="white")
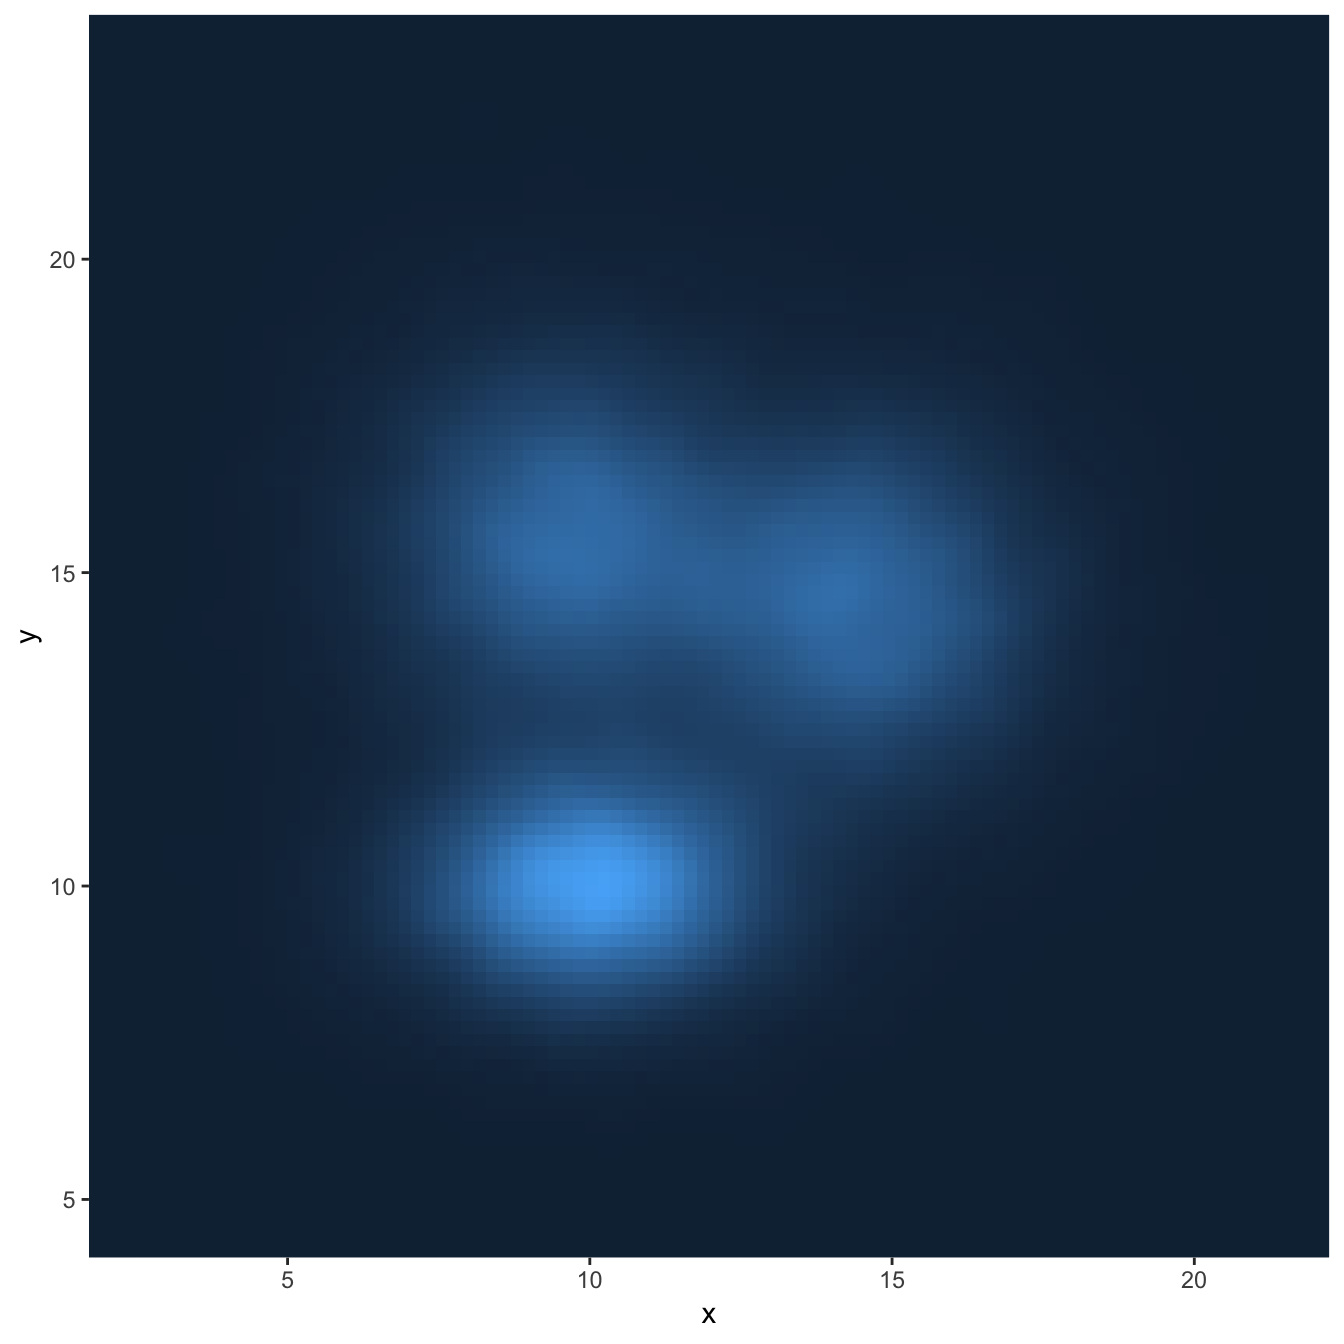
# Using raster
ggplot(data, aes(x=x, y=y) ) +
stat_density_2d(aes(fill = ..density..), geom = "raster", contour = FALSE) +
scale_x_continuous(expand = c(0, 0)) +
scale_y_continuous(expand = c(0, 0)) +
theme(
legend.position='none'
)Customize the color palette
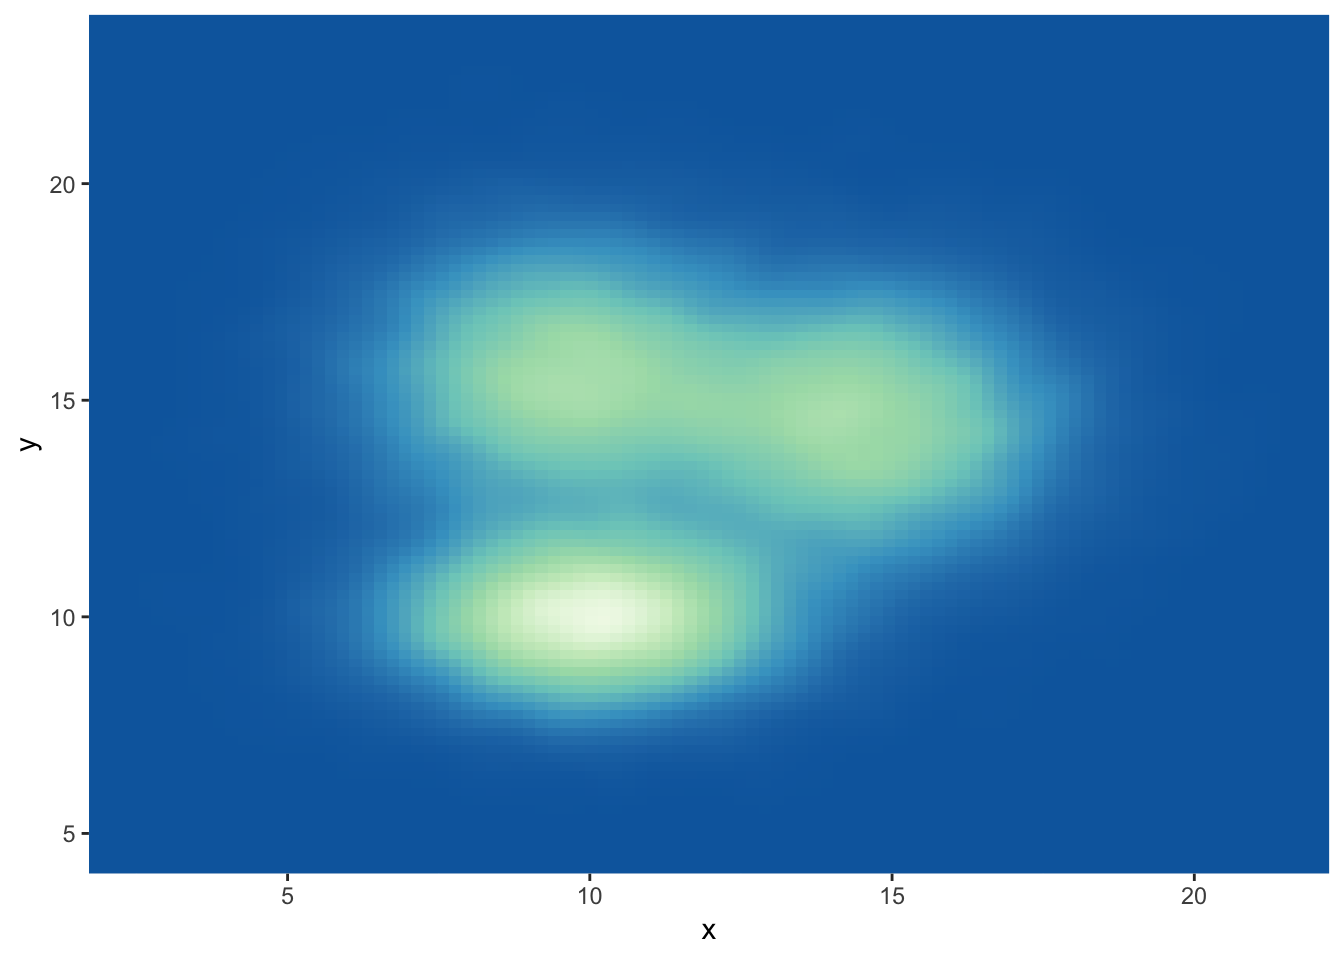
Whatever you use a 2d histogram, a hexbin chart or a 2d distribution, you can and should custom the colour of your chart. Here is a suggestion using the scale_fill_distiller() function. You can see other methods in the ggplot2 section of the gallery.
# Call the palette with a number
ggplot(data, aes(x=x, y=y) ) +
stat_density_2d(aes(fill = ..density..), geom = "raster", contour = FALSE) +
scale_fill_distiller(palette=4, direction=-1) +
scale_x_continuous(expand = c(0, 0)) +
scale_y_continuous(expand = c(0, 0)) +
theme(
legend.position='none'
)
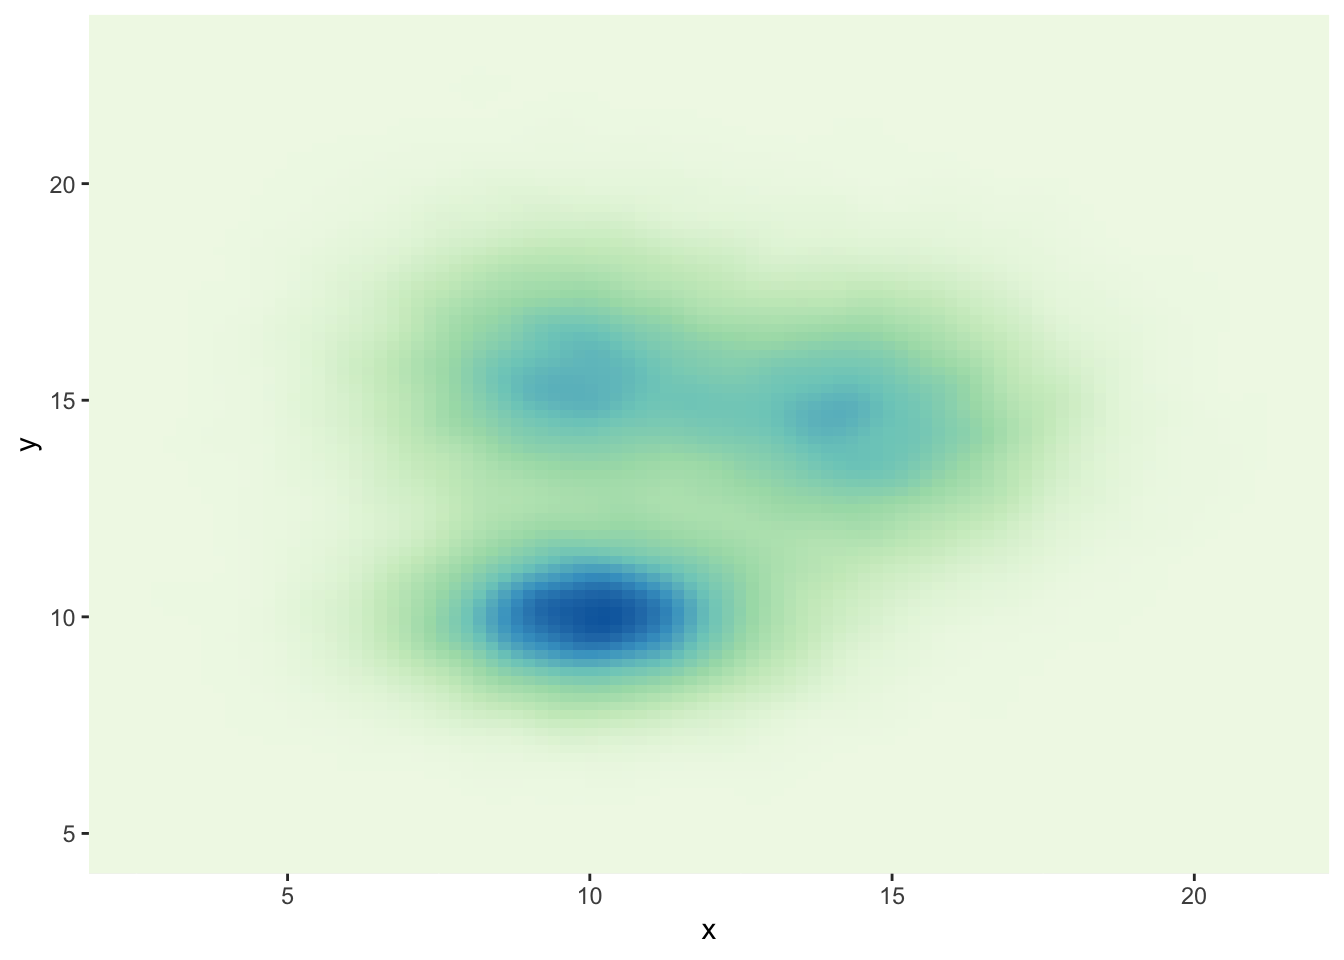
# The direction argument allows to reverse the palette
ggplot(data, aes(x=x, y=y) ) +
stat_density_2d(aes(fill = ..density..), geom = "raster", contour = FALSE) +
scale_fill_distiller(palette=4, direction=1) +
scale_x_continuous(expand = c(0, 0)) +
scale_y_continuous(expand = c(0, 0)) +
theme(
legend.position='none'
)
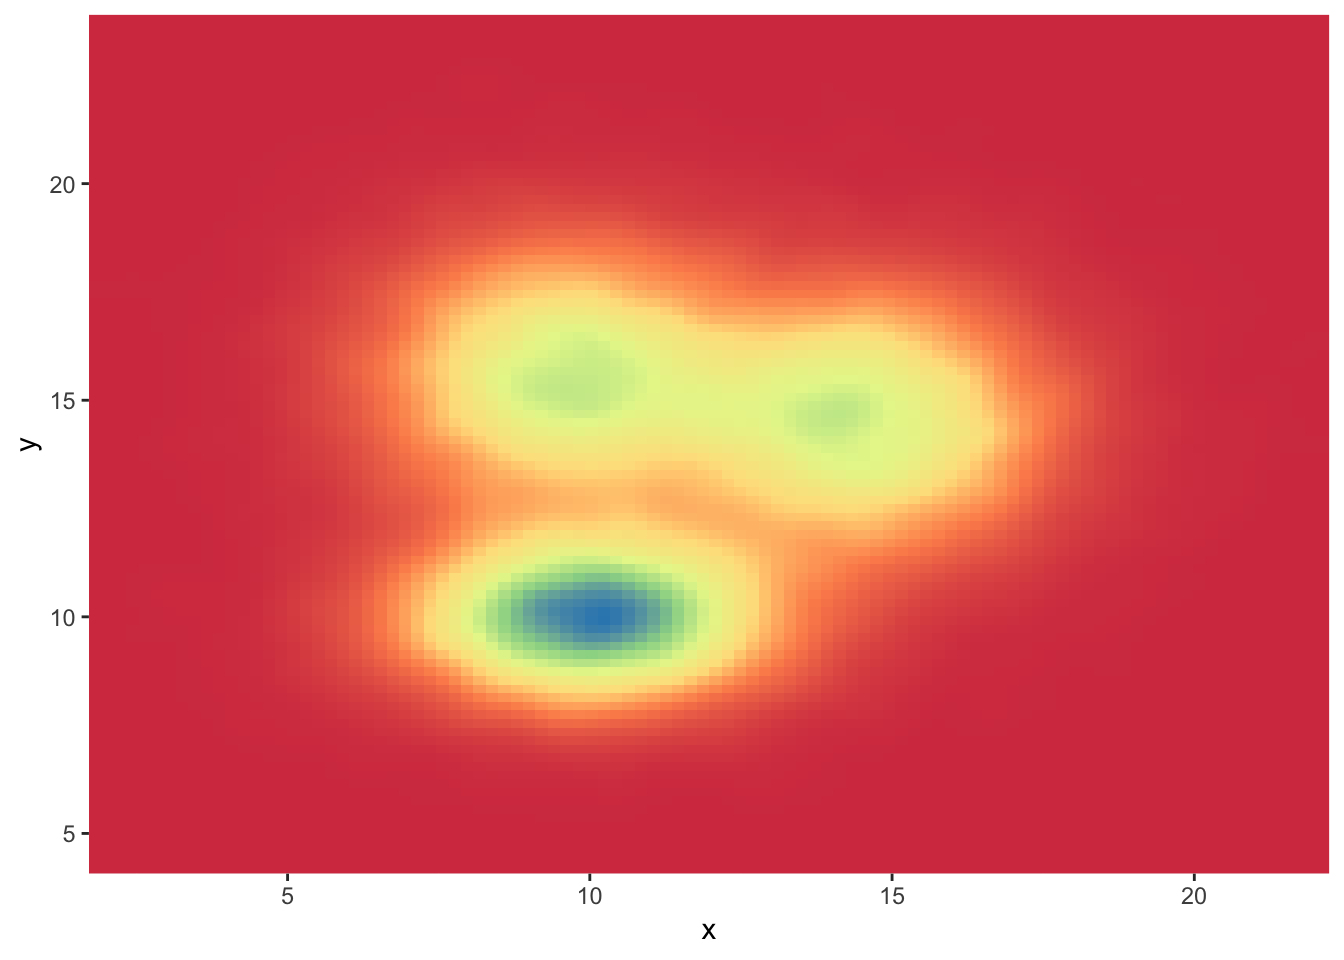
# You can also call the palette using a name.
ggplot(data, aes(x=x, y=y) ) +
stat_density_2d(aes(fill = ..density..), geom = "raster", contour = FALSE) +
scale_fill_distiller(palette= "Spectral", direction=1) +
scale_x_continuous(expand = c(0, 0)) +
scale_y_continuous(expand = c(0, 0)) +
theme(
legend.position='none'
)