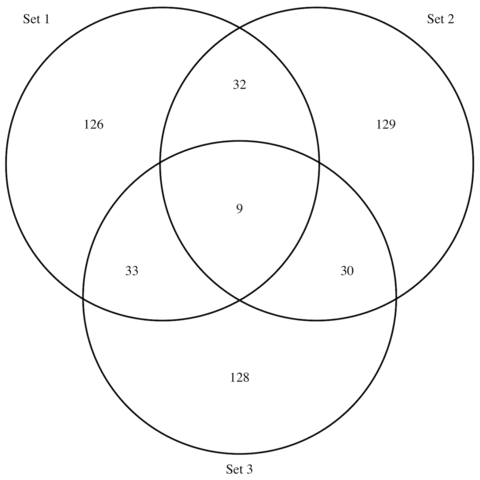
Step by step - the
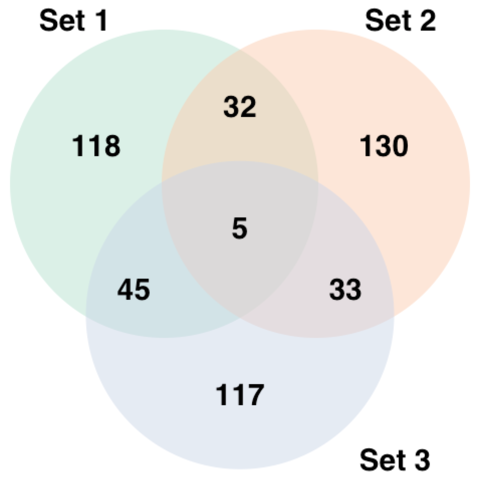
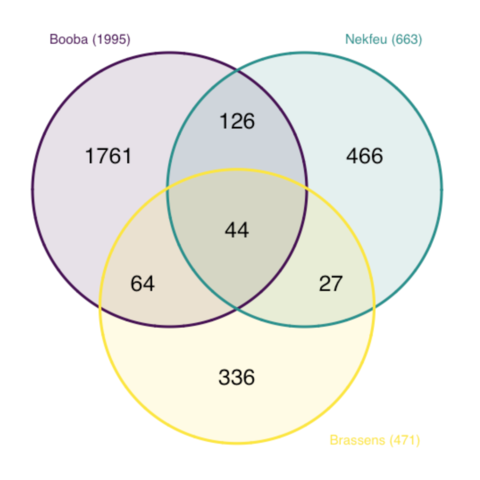
VennDiagram packageThe VennDiagram package is the best way to build Venn Diagrams in R. The 3 examples below will guide you through its functioning, from basic examples to customized charts.
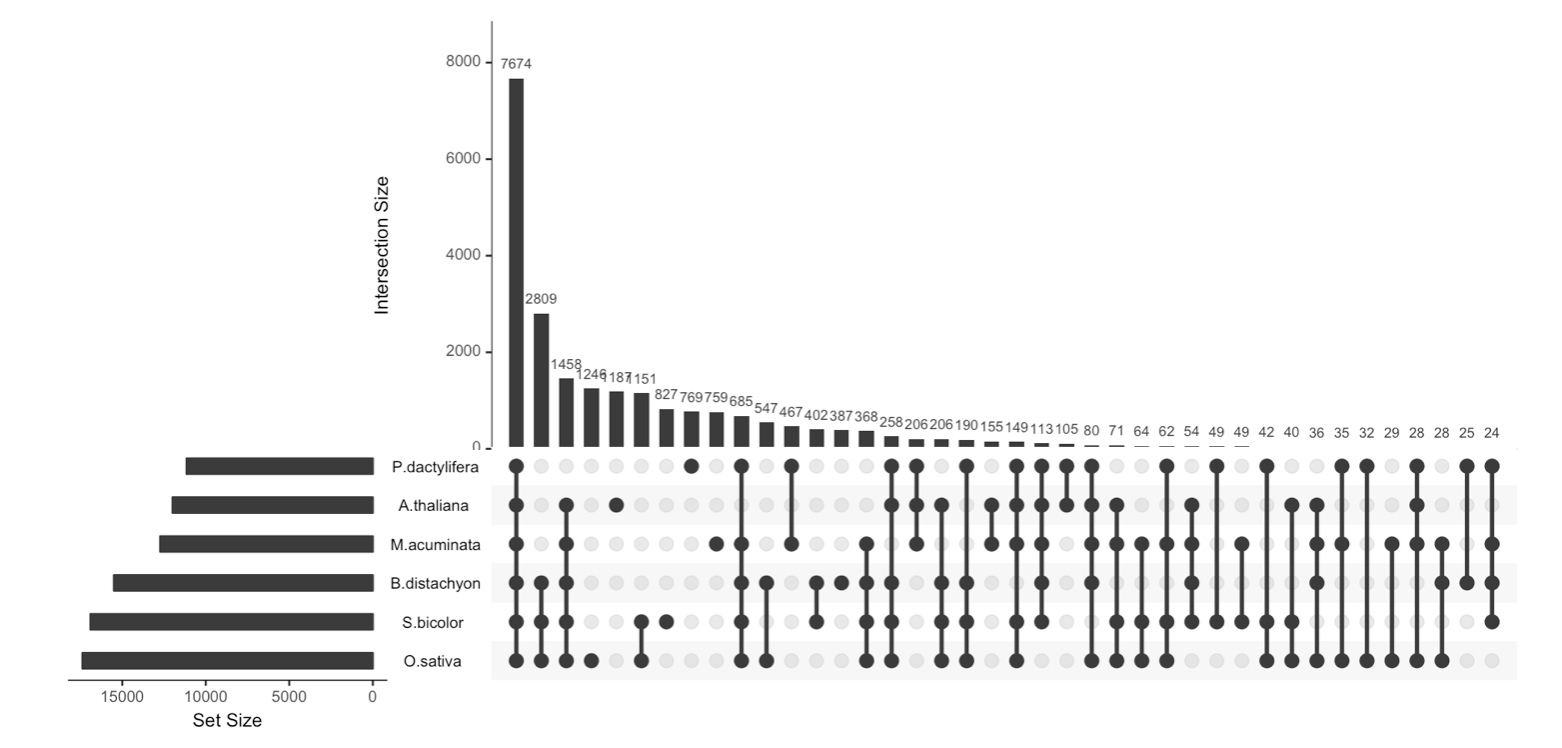
Switch to the upsetChart with
UpSetRAn Upset plot is an alternative to the Venn Diagram used to deal with more than 3 sets. Indeed, a classic Venn Diagram gets to cluttered and unreadable with four groups or more. The upSet plot is built in R thanks to the upSetR package.