MESH_DISPLAY is a MATLAB program which plots the nodes and elements of a polygonal mesh, with optional numbering.
MESH_DISPLAY reads two files describing the node coordinates and the elements of a polygonal mesh, and plots them.
mesh_display ( 'prefix', node_vis, element_vis )where 'prefix' is the common prefix for the node and element files:
The computer code and data files described and made available on this web page are distributed under the GNU LGPL license.
BEZIER_SURFACE_DISPLAY, a MATLAB program which displays a Bezier surface;
FEM_BASIS_T3_DISPLAY, a MATLAB program which displays a basis function associated with a linear triangle ("T3") mesh.
FEM_BASIS_T6_DISPLAY, a MATLAB program which reads a quadratic triangle mesh and displays any associated basis function.
GRID_DISPLAY, a MATLAB library which can display a 2D or 3D grid or sparse grid.
GRIDLINES, a MATLAB library which gives the user more control over drawing gridlines on a graph than the builtin "grid on" command.
MESH_DISPLAY_OPENGL, a C++ program which reads data defining a polygonal mesh and displays it using OpenGL.
MPAS_GRID_DISPLAY, a directory of MATLAB programs which can read an MPAS NETCDF grid file and display the primary polygonal mesh or the dual triangular mesh.
POLYGONAL_SURFACE_DISPLAY, a MATLAB program which displays a surface in 3D described as a set of polygons;
QUAD_SURFACE_DISPLAY, a MATLAB program which plots piecewise bilinear data associated with a QUAD_SURFACE, that is, a 3D surface defined by a quadrilateral mesh;
TET_MESH_DISPLAY, ia MATLAB program which reads in the node and tetra files defining a tet mesh and displays a wireframe image.
TRI_SURFACE_DISPLAY, a MATLAB program which reads data defining a triangular mesh of a 3D surface and displays it.
TRIANGULATION_DISPLAY, a MATLAB program which displays the nodes and elements of a triangulation on the MATLAB graphics screen;
TRIANGULATION_DISPLAY_OPENGL, a C++ program which reads files defining a triangulation and displays an image using Open GL.
TRIANGULATION_PLOT, a MATLAB program which plots a triangulation as a PostScript file.
XY_DISPLAY, a MATLAB program which reads XY information defining points in 2D, and displays an image in a MATLAB graphics window;
XYF_DISPLAY, a MATLAB program which reads XYF information defining points and faces in 2D, and displays an image in a MATLAB graphics window.
XYL_DISPLAY, a MATLAB program which reads XYL information defining points and lines in 2D, and displays an image in a MATLAB graphics window.
XYZ_DISPLAY, a MATLAB program which reads XYZ information defining points in 3D, and displays an image in the MATLAB graphics window.
XYZF_DISPLAY, a MATLAB program which reads XYZF information defining points and faces in 3D, and displays an image using OpenGL.
XYZL_DISPLAY, a MATLAB program which reads XYZL information defining points and lines in 3D, and displays an image in a MATLAB graphics window.
DRAGON is a mesh of hexagons.
ELL is an L-shaped region covered by triangles.
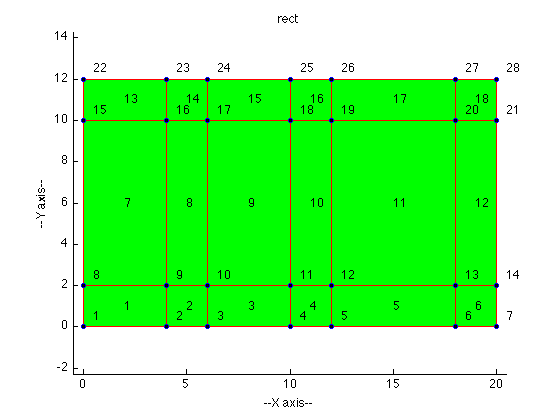
RECT is a rectangular region covered by quadrilaterals.
Q4 is a rectangular region covered by quadrilaterals, with a hole.
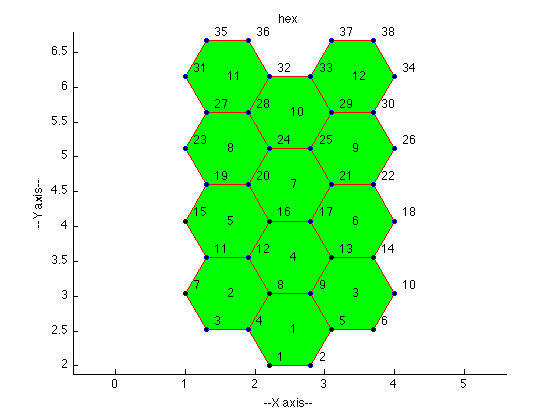
HEX is a mesh of hexagons.
You can go up one level to the MATLAB source codes.