Unhandled errors occurring during message processing will result in messages being placed into the Error Queue, with a link to the cause of the error included in the Message Event panel:
Such message errors will not be included in the system log without explicit configuration.
View Error Details
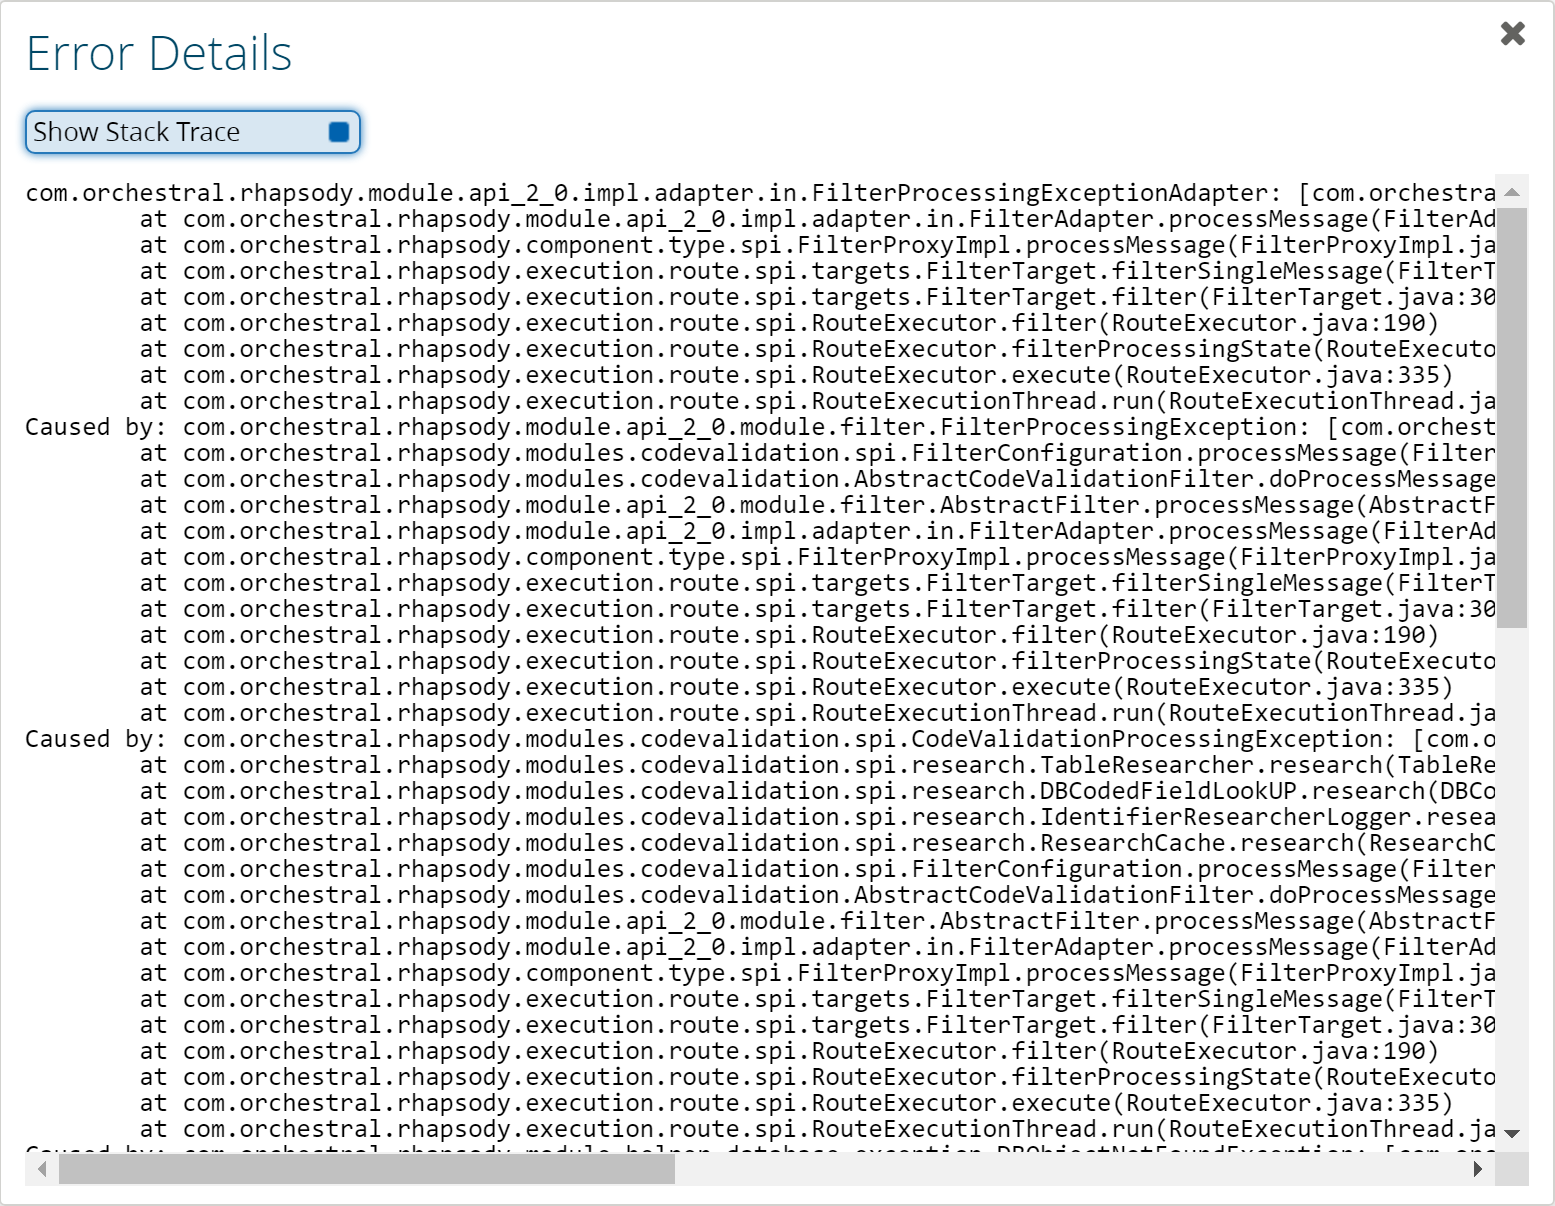
Clicking the View error details link displays a detailed error report presented as a Java stack trace in the Error Details dialog. Note that multiple causes of an error will be represented as an error cascade, so it is important to check all Caused by entries to determine the most significant one.
Show or Hide the Stack Trace
The full stack trace is displayed by default. Deselect the Show Stack Trace checkbox to hide the full stack trace for the error for ease of review:
To hide the full stack trace by default, set the WebMonitoringService.showSimplifiedErrorByDefault property in the rhapsody.properties file to true.


