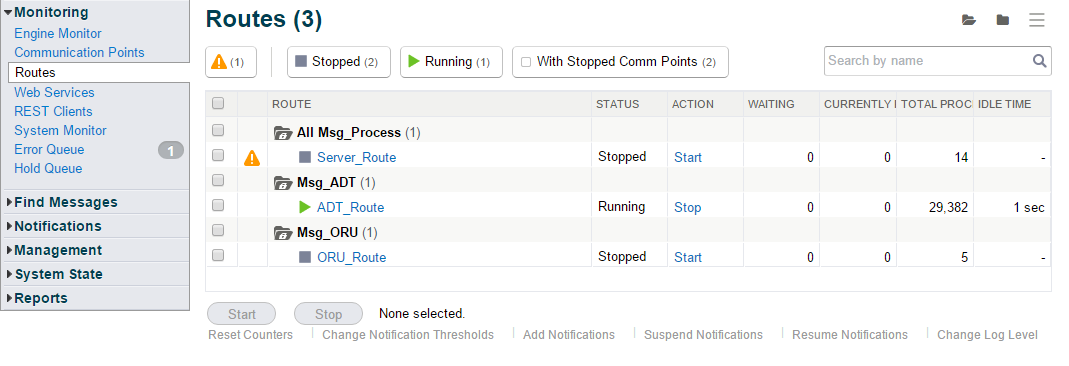
Menu Path : Monitoring>Routes |
Read Access Rights:
|
Write Access Rights:
|
The Routes page displays a list of all routes, along with a count of the messages currently being processed, waiting to be processed and the total processed.
The following table describes the route information displayed on this page:
Column |
Description |
|---|---|
Route |
The name and status of the route. Click the route name to display the details of the route on the Route Details page. The status of the route is indicated by the following icons:
|
| Status | The status of the route. |
Action |
Enables you to start or stop a route depending on its status. To change the status of a route, in the Action column, click the Start or Stop link for that route. Alternatively:
|
Waiting |
The number of messages waiting on this communication point to be processed by the route. |
Currently Processing |
The number of messages currently being processed by the route. |
Total Processed |
The number of messages processed by the route. |
Idle Time |
The period of time (in seconds, minutes, hours or days) since a message was last processed by this route. |
Viewing Components
You can use the following actions to configure how the list of routes is displayed:
Action |
Description |
|---|---|
| List View | Enables you to switch from tree view to list view. |
| Tree View | Enables you to switch from list view to tree view. |
| Collapse All | Enables you to collapse all folders (in tree view only). |
| Expand All | Enables you to expand all folders (in tree view only). |
Filtering Components
You can use the following actions to filter the list of components:
Action |
Description |
|---|---|
Filter buttons |
Enable you to filter the list based on component operational status or issue severity status. |
Search field |
Enables you to filter the list based on component name using a regular expression. The Management Console supports Java Regex. The following characters, which are allowed in component names, must be prepended with a backslash in order to be used as special characters in the regular expression: " |
Configuring Components
You can perform the following actions on routes in the list:
Action |
Description |
|---|---|
Start |
Start the selected route. |
Stop |
Stop the selected route. |
Reset Counters |
Click the Reset Counters link to reset the message counts for the selected routes. The count is user specific. |
Change Notification Thresholds |
Click the Change Notification Thresholds link to set up custom thresholds for the selected components. Refer to Change Thresholds for details. |
Add Notifications |
Click the Add Notifications link to set up notifications for the selected communication point. Refer to Notifications for details. You can only add recipients from the components list page. To reset default notification settings or remove notifications for a user, click the Change link in the Notifications section on the Route Details page, click the Remove icon for a user from the Add Notifications dialog and click the Apply button. |
Suspend Notifications |
Click the Suspend Notifications link to stop sending text messages, pager messages, emails and SNMP to notify of any Warnings, Alarms and Escalations that are raised. |
Resume Notifications |
Click the Resume Notifications link to resume sending text messages, pager messages, emails and SNMP to notify of any Warnings, Alarms and Escalations that are raised. |
Change Log Level |
Click the Change Log Level link to display the Change Log Level dialog, where you can set the log level for the selected routes from |


