Menu Path : Monitoring>Communication Points>Communication Point Details |
Read Access Rights:
|
Write Access Rights:
|
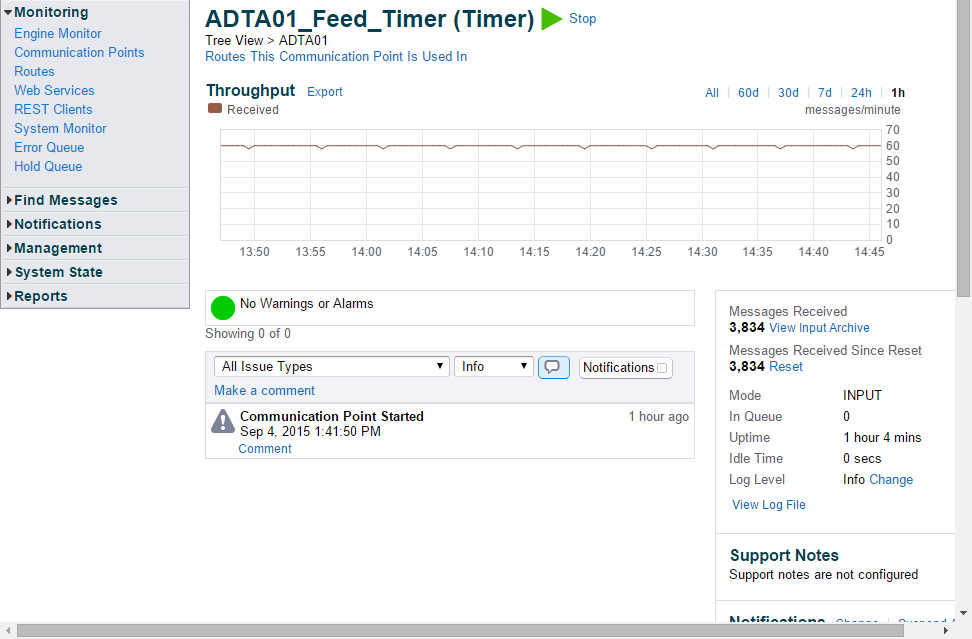
The Communication Point Details page displays details and statistics for the communication point and the routes where the communication point is used. It consists of the following panels:
Overview
Field/Action |
Description |
||||||||||||||
|---|---|---|---|---|---|---|---|---|---|---|---|---|---|---|---|
Name |
The name of the communication point, for example, TCP Service 11001 (TCP Server). |
||||||||||||||
Status |
Communication points can take on the following states:
A clock icon superimposed on the status icon indicates the communication point has scheduling enabled. |
||||||||||||||
Communication Point Location |
The name and path of the folder (if any) where the communication point is located. Organizing communication points into folders and sub-folders is accomplished through Rhapsody IDE. For example, |
||||||||||||||
Start Communication Point/Stop Communication Point |
Depending on the current status of the communication point, click the link to stop or start the communication point. You can only start or stop communication points with scheduling enabled if you have the 'Start/stop communication points with scheduling enabled' access right. In the absence of appropriate permissions, this link is not displayed. |
Routes This Communication Point Is Used In
Click the Routes This Communication Point Is Used In link to view the routes in which this communication point is used. Click the Hide link to hide the table.
Field/Action |
Description |
|---|---|
Input |
Displays all the input communication points and cross-connected routes associated with the route where this communication point is used. For each component, the following information is displayed:
If the input communication point is a Dynamic Router communication point, then the details of the statically connected upstream route and the name of the connecting Dynamic Router communication point are also displayed. Click on any component's name to display the component's details page. |
Route |
The routes in which this communication point is used. |
Output |
Displays all the output communication points and cross-connected routes associated with the route where this communication point is used. For each component, the following information is displayed:
If the output communication point is a Dynamic Router communication point, then the details of the statically connected downstream route and the name of the connecting Dynamic Router communication point are also displayed. Click on any component's name to display the component's details page. |
Throughput
The graph displays the messages that have been sent, received and failed on a communication point over time. This enables you to monitor and view processing trends, for example, message spikes. You can alter the display period of the graph as follows:
- All - displays all processed messages.
- 60d - displays messages processed in the last 60 days.
- 30d - displays messages processed in the last 30 days.
- 7d - displays messages processed in the last 7 days.
- 24h - displays messages processed in the last 24 hours.
- 1h - displays messages processed in the last 1 hour.
To zoom, click and drag on the graph.
The Advanced button enables you to show or hide the Failed line graph. It is disabled by default.
Exporting Statistics
The throughput and system statistics can be exported as a CSV file that contains the following information:
| Column | Description |
|---|---|
| Component Type | The component type:
|
| Component Identifier | The identifier of the component. |
| Component Name | The name of the component (if the component type is the system, the engine name is displayed). |
| Statistics Type | The type of throughput statistics:
|
| Timestamp | The time in the current time zone when the throughput statistic was collected. When using UTC for export time, the time is recorded in UTC. |
| Value | The number of messages collected within the given time period based on the Statistics Type. |
| Optional Value | When using UTC for export time, Optional Value is the offset in milliseconds added to the time of export in the current time zone to obtain the time in UTC; when not using UTC, the offset is zero. |
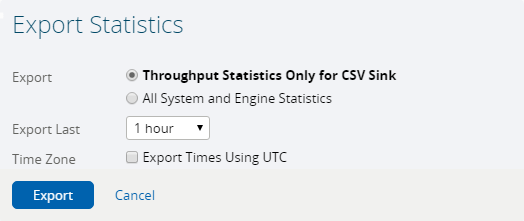
- Click the Export link in the Throughput panel to display the Export Statistics dialog:
Select one of the following radio buttons:
Option
Description
Throughput Statistics Only for <communication point name>
Only exports the throughput statistics for a specific individual communication point.
All System and Engine Statistics
Exports all statistics types for the system.
- Select the collection time period of statistics you want to export from the Export Last drop-down list.
Select the Export Times Using UTC checkbox if you want to export the data using Coordinated Universal Time (UTC) as the time zone.
If this option is not selected, the data is exported using the local time of the Rhapsody engine, which could potentially result in time discrepancies, if a daylight saving changeover occurs during the period the statistics were collected.
- Select the Export button. This exports the data to a zipped CSV file.
Activity Feed
The Activity Feed is divided into two panels:
Current Issues
The Current Issues panel displays all the current issues for the selected component, for example:
| Element | Description |
|---|---|
| Alert Severity | Indicates the level of severity (alarm or warning). |
| Issue | The name of the issue raised |
| Time | The date and time the alert was raised, and how long ago. |
| Actions | Clickable links that you can use to act upon the issues. |
Managing Current Issues
Use the following actions to manage current issues:
Action |
Description |
|---|---|
Comment |
Click the Comment link to enter a comment for the issue. |
Previously Resolved |
Click the link to filter the activity feed to display only the related historical resolved issues. This link will only show for Numerical Issues. The number represents the number of issues of the same type which are in the historically resolved part of the Activity Feed. |
Dismiss Alert |
Click the link to Dismiss the issue and enter a comment in the text box. Numerical Issues also have the option to Suspend Notifications, where you can enter the time in minutes to suspend notifications for the "Issue" (not "Issue Type"). For a Non-Numerical Issue, clicking Dismiss will move it immediately to the Historical Issues section. Clicking the Dismiss link for a Numerical Issue will mark it as "Dismissed". Rhapsody will continue to check the threshold until the issue is resolved. Once the issue is resolved, it will move to the Historical Issues section. Until the issue is resolved it will stay in the Current Issues. If the severity of the issue increases, for example from "Warning" to "Alarm", the issue will no longer appear as "Dismissed". Refer to Working with Issues for details. |
Reactivate Alert |
Click the link to cancel the "Dismissed" state, thus Reactivating the severity of the issue. Refer to Working with Issues for details. This link will only appear for Numerical Issues that are currently "Dismissed". |
Suspend Notifications |
Click the link and enter a Suspend Notification time in minutes to suspend notifications for the "Issue" (not "Issue Type"). |
Resume Notifications |
Click the link to Resume Notifications for the "Issue" (not "Issue Type"). This link will only appear when notifications for this issue are currently suspended. |
Assign |
Click the link and select a user to assign the issue to. |
Activity |
Click the Activity link to show or hide the activity for the specific issue. The number represents the number of items that will be shown. |
Because the system may be updating the state of an issue while you are in the process of performing an action on it, the system will occasionally not let you perform the action without first reviewing the changes that have happened. In this case, it will ask you to refresh the page and try the action again. You may wish to copy the text of any comment you have entered to your clipboard so that you can then have the option of pasting it after you have refreshed the page.
Historical Issues
The Historical Issues panel displays all the current issues for the selected component, for example:
| Element | Description |
|---|---|
| Filters | Clickable links that you can use to filter the list of displayed issues. |
| Alert Severity | Indicates the level of severity (alarm or warning). |
| Issue | The name of the issue raised |
| Time | The date and time the alert was raised, and how long ago. |
| Actions | Clickable links that you can use to manage the issues. |
Filtering Historical Issues
Use the following filters to filter historical issues:
| Filter | Description |
|---|---|
| Issue Types | The issue types to filter on. |
| Log Level | The issue types to filter on. |
| Show/Hide Comments | Toggle the Comments icon to view all comments relating to the Activity Feed. This does not filter comments placed against an issue. |
| Notifications | Toggle the Notifications button to view all or none of the following entries in the Activity Feed:
This shows notifications in both the Current Issues and Historical Issues panels. |
Managing Historical Issues
Use the following actions to manage historical issues:
Action |
Description |
|---|---|
Make a comment |
Click the Make a comment link to add a comment to the Activity Feed. |
| Comment | Click the Comment link next to a historical issue to comment on that specific issue. |
| Activity | Click the Activity link next to a historical issue to show or hide the activity for this issue. The number represents the number of items that will be shown. |
| Show error details | Click the Show error details link next to a historical issue to show the stack trace of any error. |
Details and Statistics
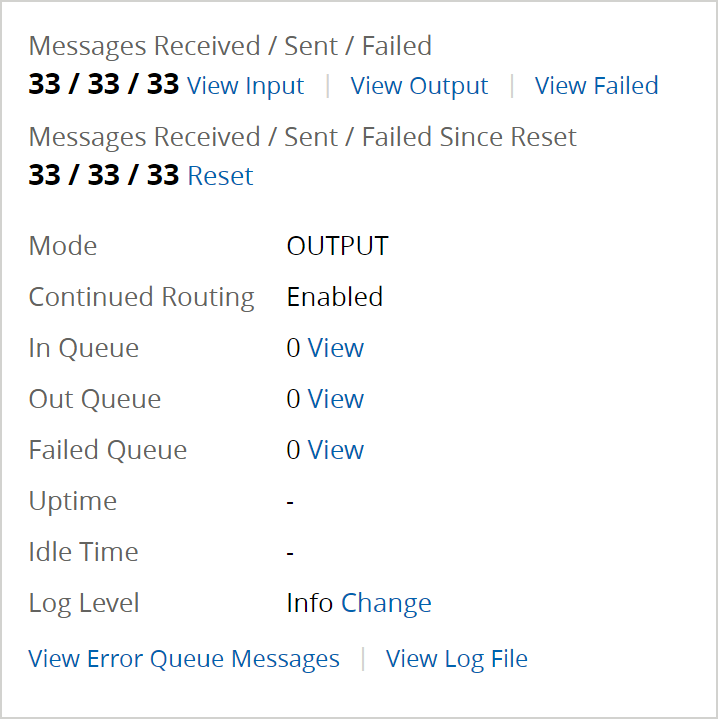
The Details and Statistics panel displays message details and statistical information:
Field |
Description |
|---|---|
Messages Received / Sent / Failed |
Depending on the mode, the number of messages received, sent or failed by the communication point since the communication point was created and started for the first time. Click the View Input, View Output and View Failed links to display a list of all incoming, outgoing and failed messages for the communication point, respectively. Messages in the archive can be filtered by their age and type, and each message opened to display its contents. For details, refer to Input Search and Output Search. |
Messages Received / Sent / Failed Since Reset |
Depending on the mode, a count of the messages received, sent or failed by the communication point since the count was reset. To reset the message count to zero, click the Reset link. The count is user specific. |
Mode |
The mode the communication is running in:
|
| Continued Routing | Indicates that the communication point is running in Output mode and configured to continue routing on success using Advanced Routing. Only displayed when continued routing on success is enabled (in Output mode). |
In Queue |
The number of messages queued for processing by the communication point. The presence of waiting messages can indicate that the route is either currently busy processing, stopped, or the communication point is currently stopped. When the communication point is stopped, click the View icon to view input waiting messages (the View icon is only displayed when the communication point is stopped). |
Out Queue |
The number of messages processed by the communication point but which cannot be sent on because the receiving system is unavailable. This field is only displayed for communication points running in output modes (Out->In, In->Out, Output, Bidirectional). When a communication point is stopped, click the View icon to view output waiting messages (the View icon is only displayed when the communication point is stopped). |
Failed Queue |
The number of messages queued for processing by the communication point via Advanced Routing, but which cannot be sent on because the receiving system is unavailable. This field is only displayed for communication points running in output modes (Out->In, Output, Bidirectional) and configured to continue routing on failure using Advanced Routing. When a communication point is stopped, click the View icon to view failed waiting messages (the View icon is displayed only when the communication point is stopped). |
Uptime |
The period of time (in seconds, minutes, hours or days) that the communication point has been running. |
Idle Time |
The period of time (in seconds, minutes, hours or days) since a message was last processed by the communication point. |
Log Level |
The log level for this component. Click the Change icon to select a log level from the drop-down list. You can select from the following log levels:
Refer to Logging Levels for details. |
View Error Queue Messages |
Click the View Error Queue Messages link to display a list of all messages that were routed to the Error Queue as a result of processing by the communication point. |
View Log File |
Click the View Log File link to display the System Log for the communication point. |
Support Notes
The Support Notes panel displays the support note you added when configuring the communication point:
Notifications
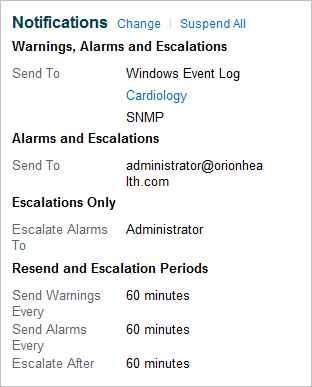
The Notifications panel displays a read-only list of all recipients (users, watchlists, emails or SNMP):
Editing Notifications
Click the Change link to display the Change Notification dialog where you can set up custom notification preferences for the selected component and override the default set up on the Default Notification Settings page.
When you click the Change link to edit the list of recipients who will receive notifications, it only applies to the selected component.
Setting any of the time periods to 0 (zero) in the Change Notification dialog will reset the time period to the default value.
To edit a watchlist notification preference, click the watchlist name to display the Watchlists page.
Suspending All Notifications
Click the Suspend All link to suspend all the notifications for the selected component. When you suspend notifications for the selected component an information banner is displayed above the Activity Feed:
Resuming Notifications
Click the Resume Notifications link to resume notifications for the selected component. Refer to Suspend / Resume All Notifications for details.
Custom Thresholds
The Custom Thresholds panel enables you to set up custom thresholds for alerts for the selected component.
For a descriptive list of alerts applicable to a communication point, refer to Default Threshold Settings.
Click the Change link to display the Change Thresholds dialog where you can setup threshold values that are appropriate for the selected component.
Select the Yes button and then select the Warning or Alarm button to raise an issue for the selected component. Select the No button if you do not wish to raise a warning or alarm for an issue for the selected component.
The changes will overwrite the Default Settings only for the issue that you have changed the threshold settings for and only for the selected component. To revert to the default settings for a particular issue, on the Change Threshold dialog, click the Use Default Settings link for an issue.
Click the Add Time Period link to set the time scale to be applied to the threshold for the component.
- To apply the time period, select a time period from the drop-down list and select the Apply button.
- To remove the time period, select a time period you want to remove from the drop-down list and click the Remove Selected Period link.
Configuration
The Configuration panel displays the configuration properties for this communication point, defined on the Configuration tab of the communication point properties dialog in Rhapsody IDE. Each communication point will have a set of properties depending on the information it requires.
Connections
The Connections panel displays the number of active connections between this communication point and all other external systems. The active connections are displayed as a list of Rhapsody-generated IDs to identify the connection uniquely followed by the connection details in brackets.
For example, the IP address, server port, and local port are displayed for the connection details for the TCP Client communication point:


