Menu Path : Reports>Performance Statistics |
Read Access Rights:
|
Write Access Rights:
|
Performance statistics for routes and filters are used to identify bottlenecks during the message processing by the whole Rhapsody engine. The collection of performance statistics must be manually started, and will automatically stop at the end of the predetermined collection period.
To start collecting statistics:
Navigate to Reports>Performance Statistics to display the Performance Statistics page:
- Select the duration for collection of performance statistics from the Collect Statistics For drop-down list.
Click the Start Collecting Statistics button.
To stop collecting statistics at any time, click the Stop Collecting Statistics link.
- To discard a statistics collection, click the Stop Collecting Statistics link, then click the Discard Statistics link.
Collected Statistics
Routes
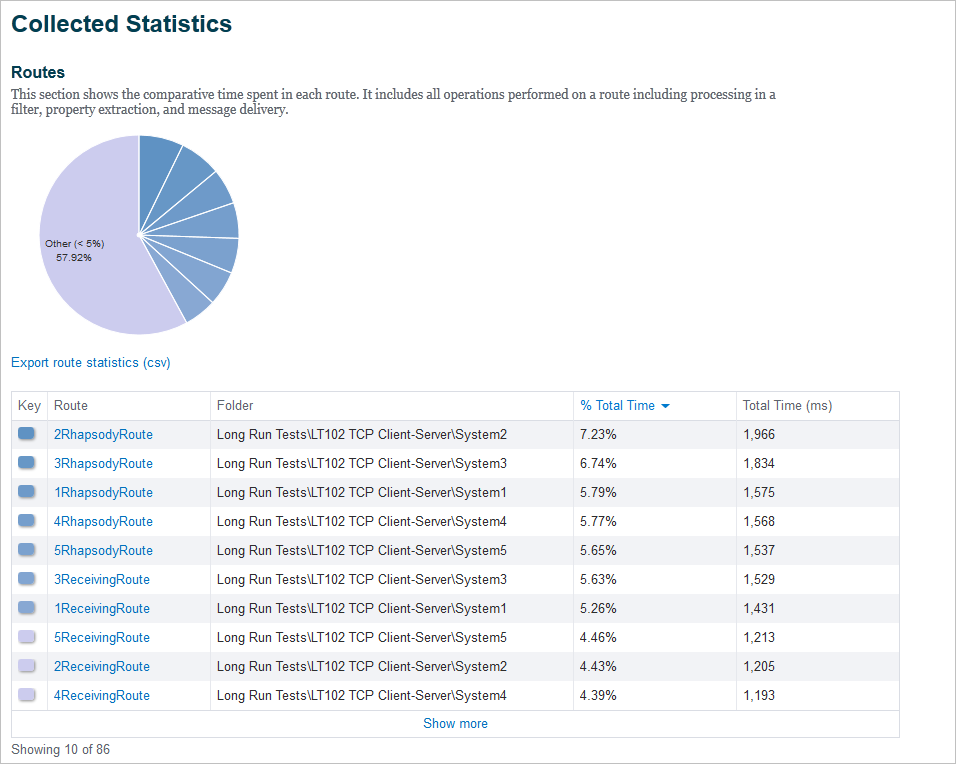
The Routes performance statistics pie chart shows the comparative time spent by messages in each of the currently active Rhapsody routes. The routes whose "percentage of total time taken to process messages" is greater than five percent are displayed as separate color-coded segments. The remainder are displayed in a single segment.
The data used to generate the pie chart is also displayed as a table. The top 10 routes which take the longest time to process messages are displayed by default.
Field |
Description |
|---|---|
Key |
Displays a colored icon. The color of the icon matches the color of the pie chart segment for the corresponding route. |
Route |
Displays the name of the route. |
Folder |
Displays the name of the folder the route is in. |
% Total Time |
Displays the percentage of total time spent by the message in the route. |
Total Time |
Displays the total time (milliseconds) spent by the message in the route. |
- To view more routes, click the Show more link.
To open a particular route's details page, click the route's name in the table. Refer to Route Details.
The 'View Locker' access right is required on the locker containing the route.
- To export route performance statistics, click the Export route statistics (csv) link.
Filters
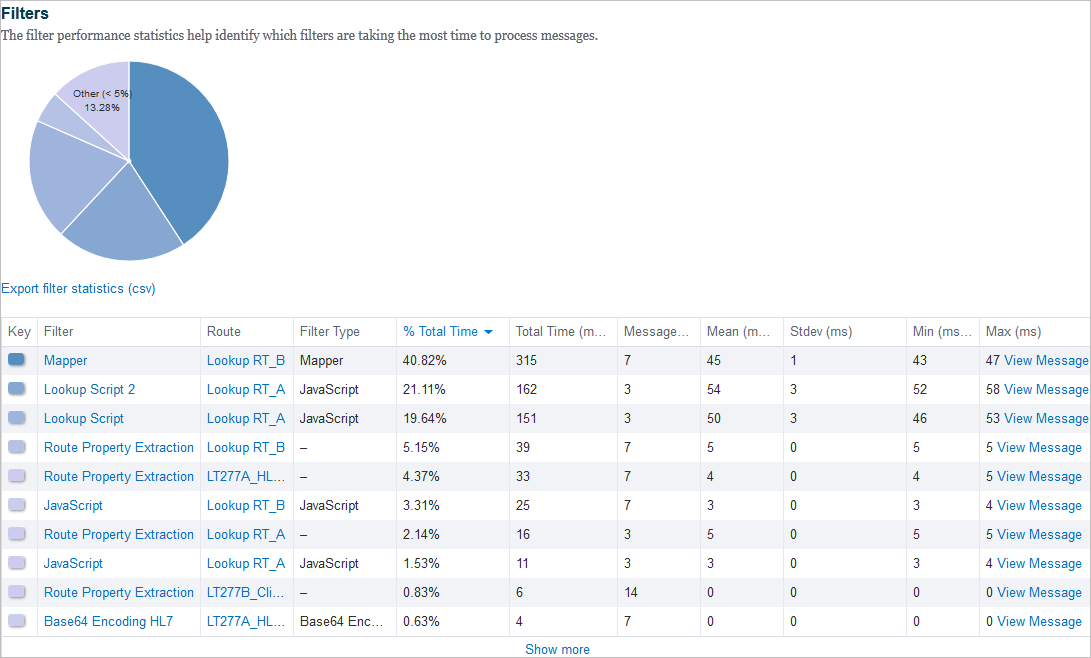
The Filters performance statistics pie chart identifies which filters take the longest time to process messages. The filters whose "percentage of total time taken to process messages" is greater than five percent are displayed as separate segments. The remainder are displayed in a single segment. The Segments are color coded.
The data used to generate the pie chart is also displayed as a table. The top 10 filters which take the longest time to process messages are displayed by default.
Field |
Description |
|---|---|
Key |
Displays a colored icon. The color of the icon matches the color of the pie chart segment for the corresponding filter. |
Filter |
Displays the name of the filter. |
Route |
Displays the name of the route the filter belongs to. |
Filter Type |
Displays the filter type. |
% Total Time |
Displays the percentage of total time taken by the filter to process messages. |
Total Time |
Displays the total time (milliseconds) taken by the filter to process messages. |
Messages |
Displays the number of messages processed by the filter. |
Mean |
Displays the average time (milliseconds) for a filter to process messages on an individual route. |
Stdev |
Displays the standard deviation (a measure of how much the values deviated from the mean) for a filter processing messages on an individual route. |
Min |
Displays the minimum time (milliseconds) for a filter to process a message on an individual route. |
Max |
Displays the maximum time (milliseconds) for a filter to process a message on an individual route. The View Message link is only available if you have the 'View message body' or 'View message property' access right. |
- To view more filters, click the Show more link.
To open a filter's details screen, click its name. Refer to Filter Details or Route Details.
To open a filter's details screen the 'View Locker' access right is required on the appropriate locker.
- To export filter performance statistics, click the Export filter statistics (csv) link.


