Menu Path : Reports>Response Latency |
Read Access Rights:
|
Write Access Rights:
|
Response Latency is a measure of the elapsed time for an external system to respond to a message sent to it.
Response latency is only possible on Out->In communication points.
Generating or Exporting Reports
To view or export Response Latency statistics:
Navigate to Reports>Response Latency to display the Response Latency page:
Enter the following details:
Field
Description
From
Enter the start date and time for your generated report (set to 24 hours before the current time by default).
To
Enter the end date and time for your generated report.
Time Zone
If you want to export the data using UTC (Coordinated Universal Time) as the time zone, select the Export Times Using UTC checkbox.
If this option is not selected, the data is exported using the local time of the Rhapsody engine, which could potentially result in time discrepancies if a daylight saving changeover occurs during the period the statistics were collected.
Out-In
Select an Out-In communication point from which the message left Rhapsody.
Choose one of the following options:
If you want to
Then...
Generate an on-screen display of the collected statistics
Click the Generate Report button. Refer to Response Latency Report for details.
Export response latency statistics
Click the Export Raw CSV Data link. The data is exported as a zipped
.csvfile.To view the Export Raw CSV Data link you must have permission to export response latency statistics.
- When you have finished, click the Discard Report link to clear the Response Latency report.
Response Latency Report
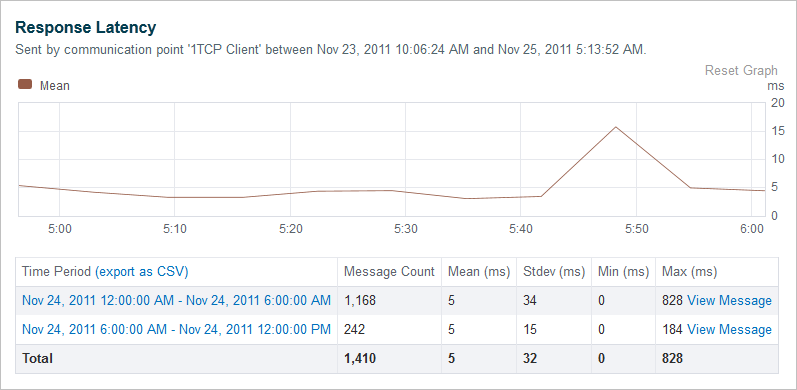
The Response Latency report shows the variation in the average time taken by an external system to respond to a message sent from the Rhapsody engine, in milliseconds. A table below the chart lists the message count, mean latency period, standard deviation (a measure of how much the values deviate from the mean), and minimum and maximum processing times
Message Details
By clicking the View Message link, you can open the Message View page to display the details of the message taking the longest time to process in any of the chart's time divisions. Message View can be useful for debugging, for example determining why some messages are slower than expected.
The View Message link requires the 'View message body' or 'View message property' access right on the appropriate locker.
Zoomed View
You can zoom into a particular section of the graph by selecting the section with your mouse. By clicking the Reset Graph link, you can reset the zoomed in view of the messages.
Data Points
By placing your mouse pointer over a data point on the graph, you can view the actual latency period at that point in time.
Error Handling
Error Type |
Error Message |
|---|---|
No date and time values entered in the From field. |
|
Either date or time value not entered in the From field. |
If characters not recognized as date or time values are entered, the date or time input turns red. |
No date and time values entered in the To field. |
|
Either date or time value not entered in the To field. |
If characters not recognized as date or time values are entered, the date or time input turns red. |
Value in the To field older than the value in the From field |
|
Out-In communication point not selected in Out-In field. |
|

