Debugging widgets using Opera Dragonfly and the Widget Emulator
Table of contents:
- Introduction
- Using Opera Dragonfly
- Testing a widget
- Testing a widget running inside the Widget Emulator
- Setting breakpoints and stepping through the code
- Editing the animation, with help from Opera Dragonfly
- Summary
Introduction
This article describes how you can use Opera Dragonfly and the Opera Widget Emulator to debug your widgets. Widgets are treated just like any other Web page in Dragonfly, and the scripts of the widget are therefore available for debugging. In addition, the Widget Emulator is itself a widget, so any code running inside it can also be debugged.
Using Opera Dragonfly
Opera Dragonfly is a lightweight developer toolkit, designed to work with a proxy interface. This allows developers to test their applications remotely from a desktop, while the application runs on another device.
To use Opera Dragonfly:
- Make sure you are running Opera 9.5 or later.
- Load the tools by pressing Ctrl+Shift+I or from selecting Tools > Advanced > Developer tools from the Opera Menu.
For detailed information about Opera’s debugging environment, see the following articles:
Testing a widget
Our test widget (the ‘animations’ widget) contains code that dynamically changes the layout for more suitable viewing when it is being used on a small screen device – instead of showing both columns at once, it only shows one column, and clicking on it switches the display to show the other column.
Opera Dragonfly contains a drop-down menu that lists the Web pages and widgets currently running in the host instance of Opera. Try loading the example widget in Opera then starting up Opera Dragonfly – when you select the widget from the drop down list, Opera Dragonfly shows that the widget has an index.html with one inline script and two linked scripts, as seen in Figure 1.
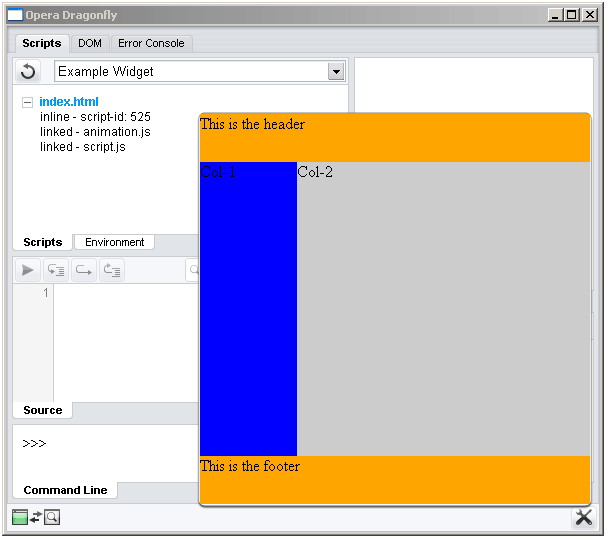
Figure 1: Opera Dragonfly showing script information for our example Widget
As you are running the widget on the desktop browser, you will not see those changes. To test that functionality, you need to use the Widget Emulator and Opera Dragonfly together. The emulator will make the widget think it is running on a small screen device – hence you will see the dynamic animation between columns when you click the visible column – Opera Dragonfly will show the result of the emulated code.
Testing a widget running inside the Widget Emulator
See the emulator documentation for information on how to run the emulator with your widget. To debug the emulated widget, run the emulator with our example widget inside it (the ‘animations’ widget) inside Opera and launch Opera Dragonfly.
Opera Dragonfly will provide a drop-down menu option for the Widget Emulator. Selecting that option will display two index.html files – one of them is the emulator itself, and the other is the widget you have running inside the emulator. It is possible to debug your widget in different modes using this mechanism. A common problem is that the JavaScript threads include emulator code, which may get confusing.
We are working on extending the Widget Emulator and Opera Dragonfly to integrate them together, allowing us to hide function calls to the emulator.
Setting breakpoints and stepping through the code
It is possible to set breakpoints in the code to step through running code. The onload event listener in the widget contains the following:
if(screen.availWidth < 600 || screen.availHeight < 600)
{
    window.resizeTo(screen.availWidth, screen.availHeight);
}
if(screen.availWidth < 400 || screen.availHeight < 400)
{
    var columnOne = document.getElementById('columnOne');
    var columnTwo = document.getElementById('columnTwo');
    // ... animation setup code ...
}
To start with, set breakpoints for our example widget at both the conditions in the event listener, and see what happens.
As can be seen in Figure 2, the second breakpoint has been reached and the variables columnOne and columnTwo have not been set. The thread is currently in the global scope and on line number 6 of script.js.
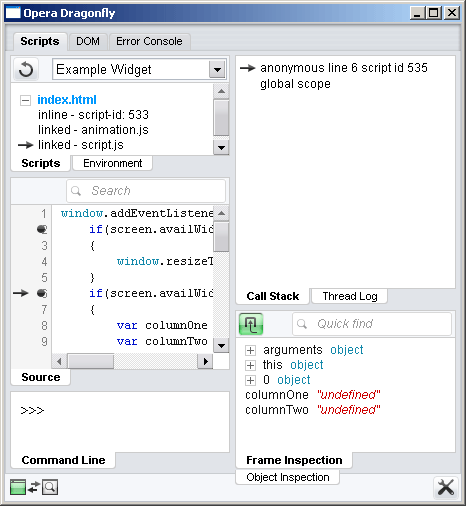
Figure 2: Opera Dragonfly window showing the breakpoints inside our script.
This information is crucial when developing complex applications.
Editing the animation, with help from Opera Dragonfly
To test the animation you must use the Widget Emulator, and to debug the animation you must use Opera Dragonfly. Both products combined give you extreme flexibility in developing applications for various devices.
Under normal development circumstances it is very important that you understand the libraries you intend to use in your code; for this example however we shall assume no knowledge of the library in use (the Opera Animation library) and modify the animation purely on information given to us by Opera Dragonfly.
Once the Widget Emulator is started, an option in Opera Dragonfly allows you to debug the Widget Emulator and widget together. To find out what happens when an animation is triggered, set a breakpoint on columnOne.animHide.run().
The widget is initialized, as seen in Figure 3.
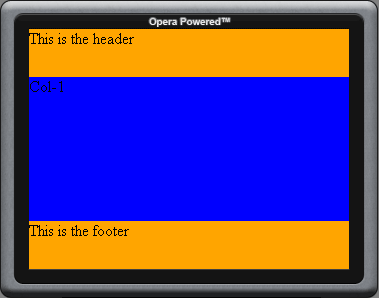
Figure 3: A widget with three columns, a header, and a footer runnning in the Widget Emulator
Click on the blue area (columnOne) and you will see the click event dispatched and two functions called: columnOne.animHide.run(); and columnTwo.animShow.run();.
Opera Dragonfly stops the thread at the breakpoint, as seen in Figure 4.
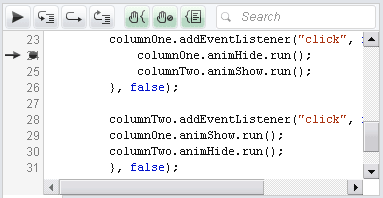
Figure 4: Close-up of hitting a breakpoint
From this moment on, you can follow what path JavaScript takes while this widget runs. This is also helpful for optimizing code.
While stepping through the code, you can find the function constant by clicking on the “Step into” icon or pressing F11; see Figure 5.
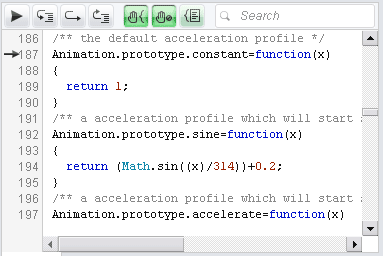
Figure 5: Stepping into the constant function.
This function represents the default linear acceleration used for animations in the widget. This is what you need to edit in order to achieve a smoother acceleration. By stepping back in the thread using the “Step out” icon or by pressing Shift+F11, you will find that animation_object.accelarationProfile is the function you need to override. You will also see that the library provides various prototypes that you can use.
Using this knowledge, add this to the onload event listener:
columnOne.animShow.accelerationProfile = Animation.prototype.decelerate;
columnOne.animHide.accelerationProfile = Animation.prototype.decelerate;
columnTwo.animShow.accelerationProfile = Animation.prototype.decelerate;
columnTwo.animHide.accelerationProfile = Animation.prototype.decelerate;
To test the widget, run it in the Widget Emulator and select a mobile profile. Clicking on the columns should provide a nice decelerating animation; see Figure 6 for an example. You can download a debugged version of the widget inside the emulator (The ‘fixed’ widget).
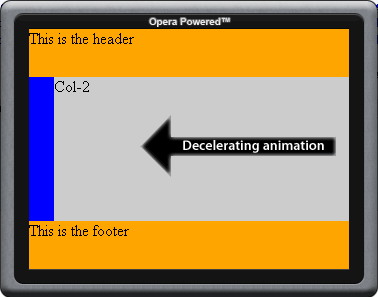
Figure 6: Model of decelerating animation
Summary
This article has shown you how you can debug an emulated widget using Opera Dragonfly. This way you can debug code paths and effects which only occur on a device. You need to place the widget inside the emulator, run the emulator and use Opera Dragonfly on the emulator widget itself. When doing this, you need to keep in mind that the emulator’s function calls are also included in the call stack in the debugger.
This article is licensed under a Creative Commons Attribution, Non Commercial - Share Alike 2.5 license.
Comments
The forum archive of this article is still available on My Opera.
No new comments accepted.