How to debug JavaScript problems with Opera
16th December 2011: This article is obsolete
This article is obsolete/out of date, so should no longer be treated as a current or reliable source of information. Most of the tools talked about here are still available, for example the error console, but a lot of debugging functionality is now handled by Opera Dragonfly. Read the Opera Dragonfly documentation for more information.
This tutorial is intended for webmasters or users with a technical interest and some experience with HTML and/or JavaScript. It will demonstrate relatively simple ways of getting to the root of the problem if a JavaScript does not work as expected in Opera.
Typical problems
Most issues Opera-users may encounter on the web falls into the following categories.
Browser blocking
Due to the different standards and levels of JavaScript supported in different browsers nearly every advanced script on the web needs to retrieve information about the browser it is running in. This is called browser sniffing and some webmasters abuse it to block browsers that are unknown or browsers they do not test with.
There is a built-in workaround in Opera: the "Identify as.." setting at the bottom of the F12 "Quick Preferences" menu. This makes Opera disguise itself as another browser and works if the browser sniffing script is not specifically looking for Opera.
The webmaster can usually amend the sniffer script to let Opera in. Opera's Open The Web project contacts webmasters who block Opera and asks them to consider making their site more accessible and sites that block Opera should be reported to them.
Faulty browser detection causing incompatible commands to be used
This is partly an effect of the "Identify as.." workaround against browser blocking. If a page thinks that Opera is IE or Netscape it may try to use code specific to either browser. This is often a problem with IE-style plugin detection, CSS filters used in JavaScripts or the Netscape-specific syntax document.layers.
Script bugs tolerated in other browsers but not in Opera
Even if a script works fine in IE and is using mostly standards-compliant code it may contain subtle bugs that will cause problems in browsers that are less tolerant of coding mistakes.
Opera bugs
If Opera handles a JavaScript command differently from what the specifications say, it is a bug in Opera. Apparent bugs may also be caused by contradictions in the specifications themselves, or differences between different specifications.
Debugging tools
The JavaScript console
JavaScript error messages are collected in the JavaScript console. They can be reviewed by going to . The section on understanding the JS console output has further details.
the postError debug function
It is possible to use a special function to write customised messages to the JavaScript console: opera.postError(). This function is only available in Opera and is useful for debugging.
Obviously it is possible to add alert() statements to keep track of code execution. However, they interrupt the running script and delay the analysis because one has to click all those OK buttons. Also, if the script goes into a loop, you may not be able to shut Opera down due to the continuous alerts. Using opera.postError() and the JavaScript console allows faster and easier debugging.
Linked scripts bookmarklet
Often, the JavaScript code is not included in the page source but loaded from another file. This bookmarklet generates a convenient list of all the external JavaScript files the currently displayed page uses. To use the bookmarklet, open the page below, right-click its link and choose "Add Link to Bookmarks".
On any page where you want an overview of linked scripts, you can open that bookmark.
Note: This bookmarklet will not work if popup windows are completely disabled. If you prefer the setting disabled you have to drag-and-drop bookmarklets from the Hotlist to the current window to launch the bookmarklet.
A source viewer/editor
If you have not chosen a source viewer, Opera will use MS Wordpad on a typical Windows installation. Many better options are available, this tutorial contains screenshots from SciTE which is a small code editor with support for syntax highlighting, bookmarking specific lines and hiding blocks of code. To tell Opera what program you prefer to use as source viewer, go to
The "Tools > Advanced > Refresh" command
This is a very powerful tool when debugging a problem because it re-loads the page from cache including any modifications we have made to the locally stored files.
Understanding the JavaScript console contents
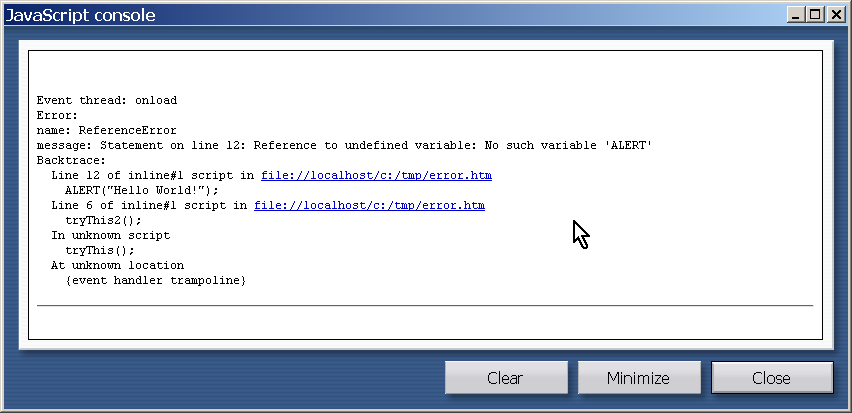
The console shows information about what went wrong and indicates where the problem was.

In this top half of the error message we can see the type of error, line number and detailed information about the problem. If the error occurs in a <SCRIPT>...</SCRIPT> block the lines are counted from and including the <SCRIPT> tag line.
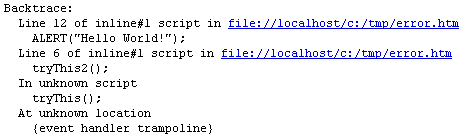
The bottom half of the message is the "backtrace" showing the most recent function calls leading to the error. These should be read from the bottom up. In this case they show that some event handler called a function named tryThis() which again called another function named tryThis2() and this function caused an error by trying to use the undefined ALERT() function which should have been spelled with lower case letters.
The backtrace is especially useful if the script calls functions located in different included JavaScript files because you can see what file each function is in.
Tip: Note the links that often are part of the error message. Clicking a link in the JavaScript console opens the corresponding file in the source viewer.
Using our tools
Nothing is like a real-world example. Here we will look at a problem with the main page of the travel agency Opodo. This was an issue on their British site for a while, I believe the script has since been fixed and Opera has also modified its scripting engine to handle this specific error.
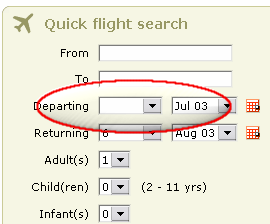
After loading Opodo's UK page we notice an odd absence of numbers in their departure date section. The departure date box goes blank just after the page finishes loading, and since it is impossible to select a departure date the whole site is unusable in Opera. (Note that recent Opera versions work around this scripting error because it was a problem on a few important sites.)
To understand the problem, we will start looking for error messages and then try to work out what exact part of the script is causing the page to malfunction.
Console analysis
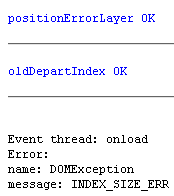
Time to start the debugging in the JavaScript console. Unfortunately the error message is not very rich in details:
Event thread: onload
Error:
name: DOMException
message: INDEX_SIZE_ERR
The error message confirms that there is some problem in the function called from the onLoad event. Let's use our Source Viewer to inspect the onLoad instruction..
Source review
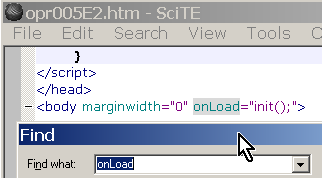
We invoke the source viewer by selecting from the menu or by pressing Ctrl+F3. The source of the page will load in the external program and we can search for the onLoad handler.
The function called from onLoad is called "init()". This means we have to find a block of JavaScript saying something similar to
function init(){
    // here goes cryptic code
}
Locate function
By searching for "init" we find the following bit of script (shortened):function init(){
detectLayering();
layerPosition();
positionErrorLayer();
calcDayOfWeek('D');
// rest of code
}What this means is that the init-function itself calls several other custom functions. One of them will contain the error that causes the problem.
Add debug code
This is where our debug function opera.postError() is handy. By inserting postError statements we can keep track of what the script is doing and where in the init function it stops executing. By editing the cached version in our source viewer we can put in a liberal amount of debug-code:
function init(){
        detectLayering();
        opera.postError('detectLayering OK'); // Debug message
        layerPosition();
        opera.postError('layerPosition OK'); // Debug message
        positionErrorLayer();
        opera.postError('positionErrorLayer OK'); // Debug message
        calcDayOfWeek('D');
        opera.postError('calcDayOfWeek OK'); // Debug message
        // rest of code
      }
Refresh Display and view Console output
Having edited and saved the code we switch to Opera and use to make Opera read the changed files, then we check the JavaScript console again to see the output. The console reveals that the message "calcDayOfWeek OK" was never written. Opera stops executing somewhere within the calcDayOfWeek function.
This means we need to locate the definition of calcDayOfWeek to work out what is wrong in this function. This function is not defined in the same file as init but the linked scripts list bookmarklet comes to the rescue and prints out a list of links to all the files Opodo uses. Some searching in the files reveals the function in http://www.opodo.co.uk/js/calendar.js, and we can repeat the strategy of viewing the source and filling the cached version with debug calls:
 // snipping above code

if((iYear%4==0 && iYear%100!=0)||(iYear%400==0)){
monthDays[1]=29;
} else {
monthDays[1]=28;
}
opera.postError('year-aware code OK '+monthDays[1]); // Debug message

}
populateDDforThisMonth(sWhich, iYear, iMonth, iDay);
opera.postError('populateDD OK', sWhich, iYear, iMonth, iDay); // Debug message
This also demonstrates how the console reporting command can be used to write out the values of variables while a script is executing. The postError function accepts both a combined string containing variable names and any number of comma-separated arguments. Comma-separated arguments will be written to the console as separate messages.
Viewing the console output shows that script execution stopped before the "populateDD OK" message was written, so the error must be in the populateDDforThisMonth function. By repeating steps 1-5 we can narrow down the "suspects" to another function called emptyDropDown and add our debug code again:
function emptyDropDown(whichDD) {
var oOptions = thisDD.options;
for (var i=oOptions.length; i>=0; i--) {
oOptions[i]     = null;
opera.postError('loop iteration'+i+' OK '); // Debug message
}
thisDD.selectedIndex=0;
opera.postError('thisDD.selectedIndex OK '); // Debug message
thisDD.length=0;
opera.postError('thisDD.length OK '); // Debug message
}
The message "thisDD.selectedIndex OK" is never written to the console, so we can now tell that this statement triggers the error that interrupts the script: thisDD.selectedIndex=0;
The error occurs because the preceding for (var i=oOptions.length; i>=0; i--) loop deleted all the options in the drop-down. The statement thisDD.selectedIndex=0; means "select the first drop-down element item" but you can not select an option that is already deleted. This is a minor bug in the script that is obviously tolerated by IE but not by Opera. This statement is also entirely superfluous since the script later on set the selectedIndex property to another value after populating the list again.
Opodo's webmaster can fix the problem by removing the statement. If I want to book a ticket with Opodo using Opera I can now do so by deleting this line, saving the cached version and using again in Opera.
Summary
To repeat quickly the steps involved in a typical debug process:
- Console and/or source view analysis to find the name of the function causing trouble
- Find problematic function definition in the page or in external JavaScript source files
- Add debug code to keep track of script execution
- Refresh display
These 4 steps are repeated as many times as necessary to drill down through the customised JavaScript functions and find the problem.
This article is licensed under a Creative Commons Attribution, Non Commercial - Share Alike 2.5 license.
Comments
The forum archive of this article is still available on My Opera.
-

Myself 404 page suport
-

So no updates right????
No new comments accepted.iconky male
Tuesday, March 27, 2012
Jane Derleenka
Friday, March 8, 2013