Steward
分享是一種喜悅、更是一種幸福
程式語言 - Python - v3.x - Graphviz
參考資訊:
https://treelib.readthedocs.io/en/latest/
https://dreampuf.github.io/GraphvizOnline/
from treelib import Node, Tree

tree = Tree()
tree.create_node("Harry", "harry")  # root node
tree.create_node("Jane", "jane", parent="harry")
tree.create_node("Bill", "bill", parent="harry")
tree.create_node("Diane", "diane", parent="jane")
tree.create_node("Mary", "mary", parent="diane")
tree.create_node("Mark", "mark", parent="jane")
tree.show()
tree.to_graphviz()
輸出
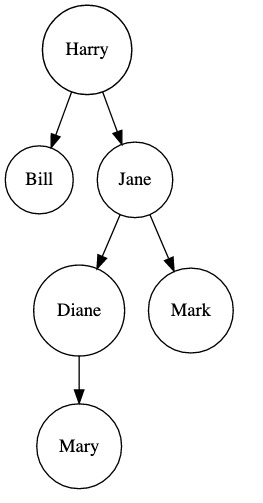
digraph tree {
	"harry" [label="Harry", shape=circle]
	"bill" [label="Bill", shape=circle]
	"jane" [label="Jane", shape=circle]
	"diane" [label="Diane", shape=circle]
	"mark" [label="Mark", shape=circle]
	"mary" [label="Mary", shape=circle]

	"harry" -> "jane"
	"harry" -> "bill"
	"jane" -> "diane"
	"jane" -> "mark"
	"diane" -> "mary"
}
把輸出的資料貼到Graphviz Online即可顯示如下圖形