This stat is the default stat used by geom_density_ridges. It is very similar to stat_density,
however there are a few differences. Most importantly, the density bandwidth is chosen across
the entire dataset.
stat_density_ridges(
  mapping = NULL,
  data = NULL,
  geom = "density_ridges",
  position = "identity",
  na.rm = FALSE,
  show.legend = NA,
  inherit.aes = TRUE,
  bandwidth = NULL,
  from = NULL,
  to = NULL,
  jittered_points = FALSE,
  quantile_lines = FALSE,
  calc_ecdf = FALSE,
  quantiles = 4,
  quantile_fun = quantile,
  n = 512,
  ...
)
Arguments
| mapping | Set of aesthetic mappings created by |
|---|---|
| data | The data to be displayed in this layer. There are three options: If A A |
| geom | The geometric object to use to display the data. |
| position | Position adjustment, either as a string, or the result of a call to a position adjustment function. |
| na.rm | If |
| show.legend | logical. Should this layer be included in the legends?
|
| inherit.aes | If |
| bandwidth | Bandwidth used for density calculation. If not provided, is estimated from the data. |
| from, to | The left and right-most points of the grid at which the density is to be estimated,
as in |
| jittered_points | If |
| quantile_lines | If |
| calc_ecdf | If |
| quantiles | Sets the number of quantiles the data should be broken into. Used if either |
| quantile_fun | Function that calculates quantiles. The function needs to accept two parameters,
a vector |
| n | The number of equally spaced points at which the density is to be estimated. Should be a power of 2. Default is 512. |
| ... | other arguments passed on to |
Examples
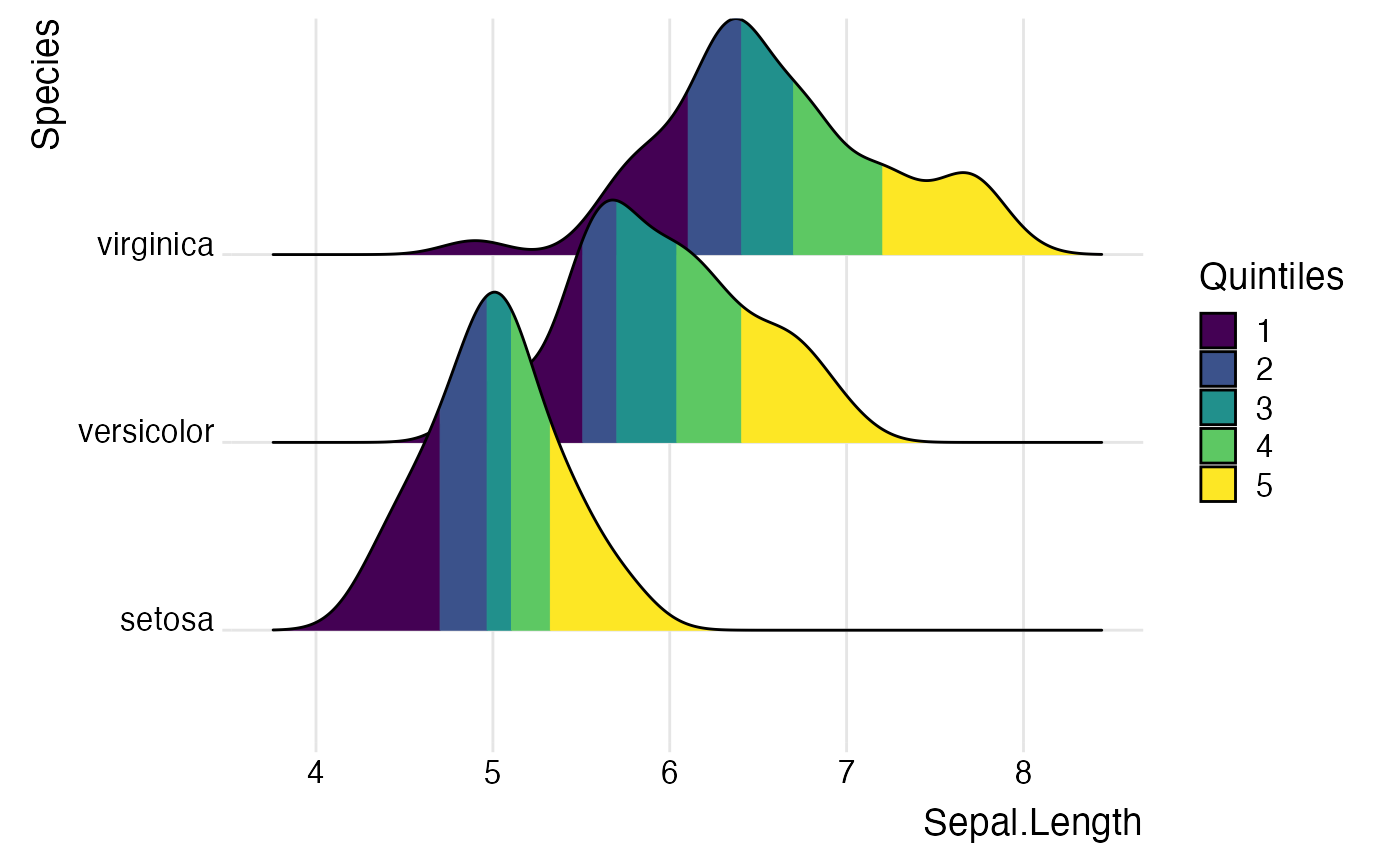
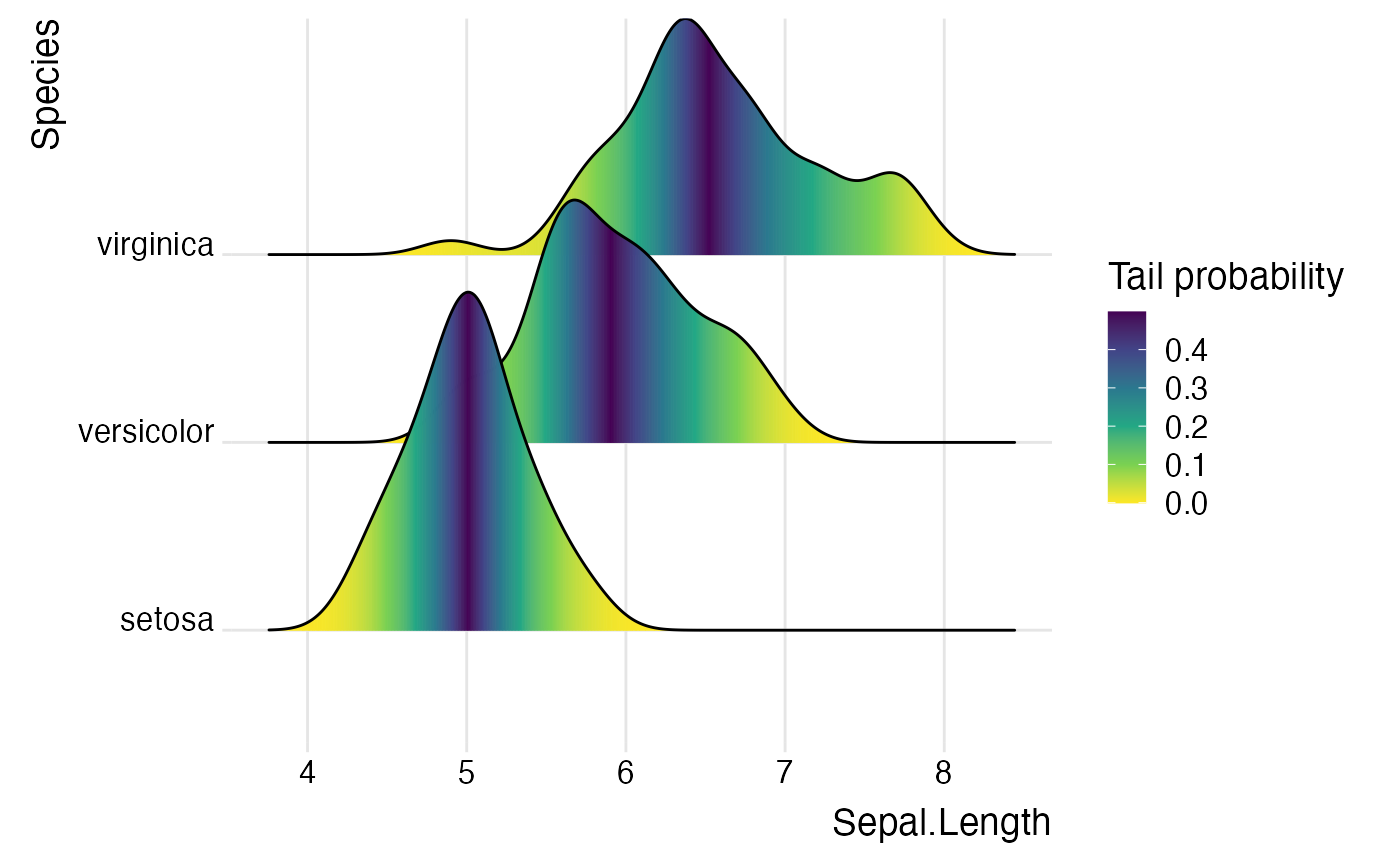
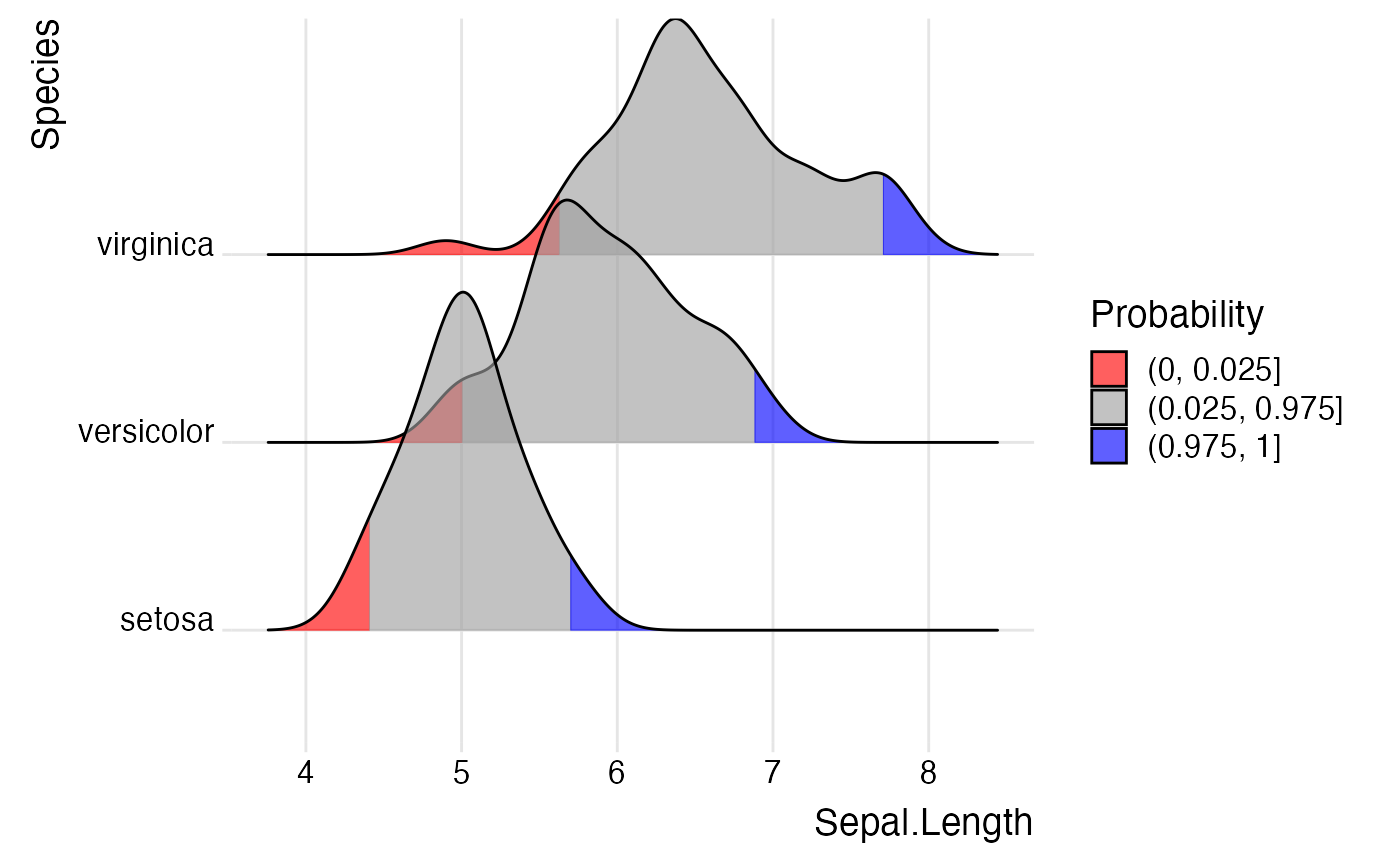
library(ggplot2) # Examples of coloring by ecdf or quantiles ggplot(iris, aes(x = Sepal.Length, y = Species, fill = factor(stat(quantile)))) + stat_density_ridges( geom = "density_ridges_gradient", calc_ecdf = TRUE, quantiles = 5 ) + scale_fill_viridis_d(name = "Quintiles") + theme_ridges()#>ggplot(iris, aes( x = Sepal.Length, y = Species, fill = 0.5 - abs(0.5-stat(ecdf)) )) + stat_density_ridges(geom = "density_ridges_gradient", calc_ecdf = TRUE) + scale_fill_viridis_c(name = "Tail probability", direction = -1) + theme_ridges()#>ggplot(iris, aes( x = Sepal.Length, y = Species, fill = factor(stat(quantile)) )) + stat_density_ridges( geom = "density_ridges_gradient", calc_ecdf = TRUE, quantiles = c(0.025, 0.975) ) + scale_fill_manual( name = "Probability", values = c("#FF0000A0", "#A0A0A0A0", "#0000FFA0"), labels = c("(0, 0.025]", "(0.025, 0.975]", "(0.975, 1]") ) + theme_ridges()#>