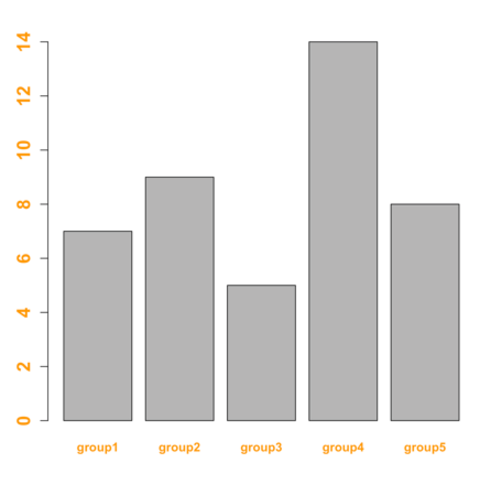
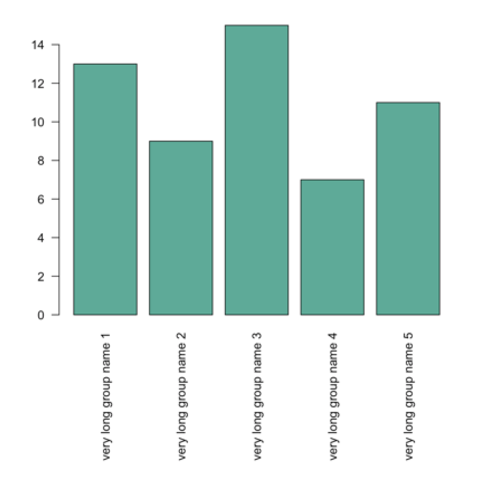
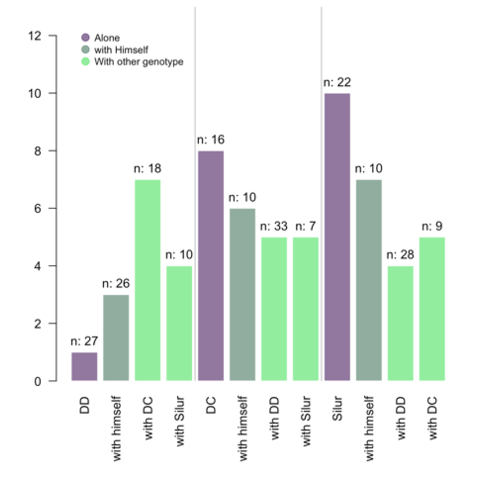
Step by step -
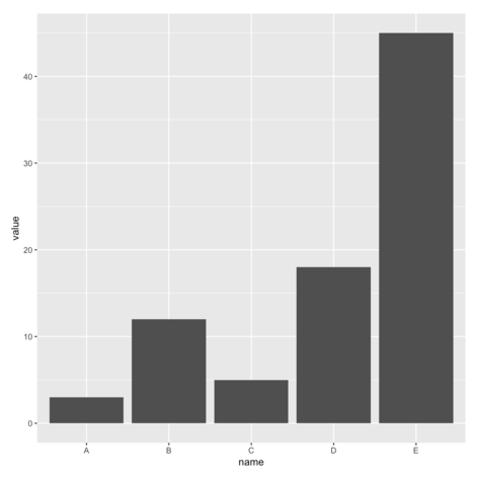
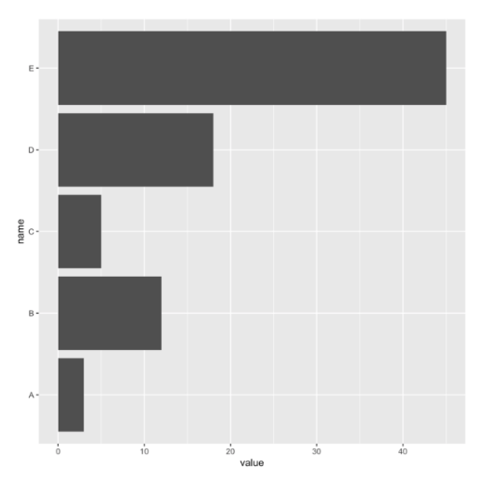
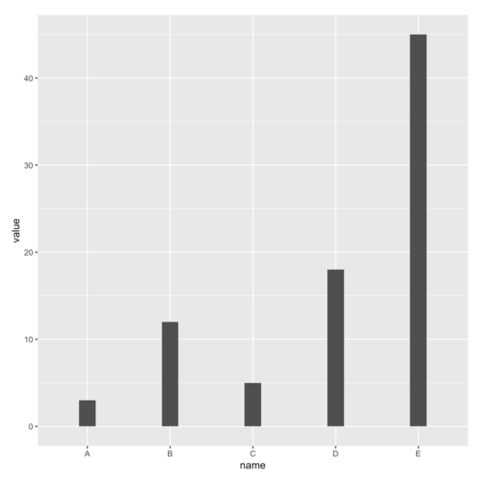
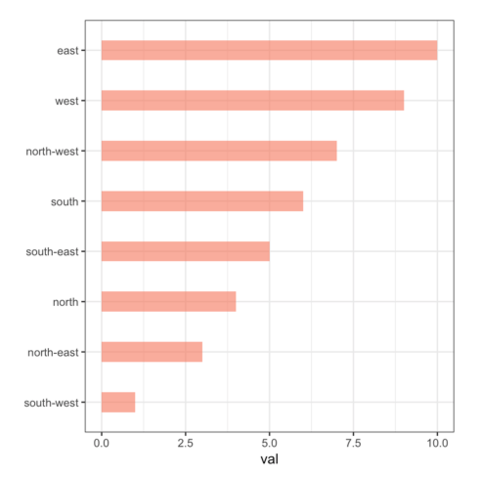
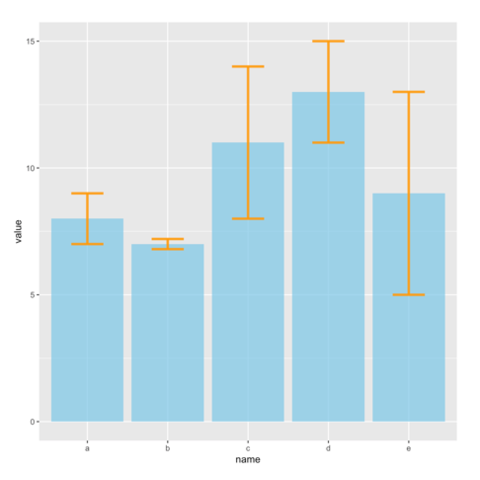
ggplot2 and geom_bar()ggplot2 allows to build barplot thanks to the geom_bar() function. The examples below will guide you through the basics of this tool:
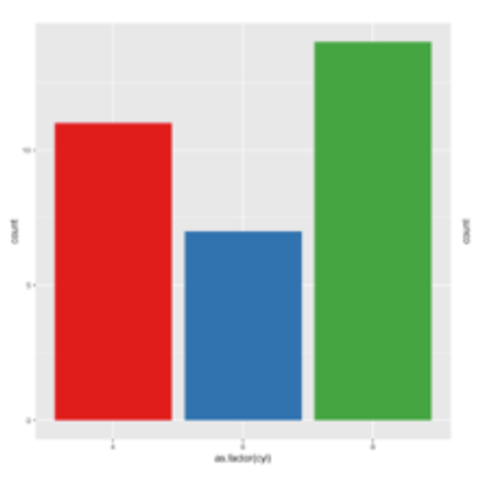
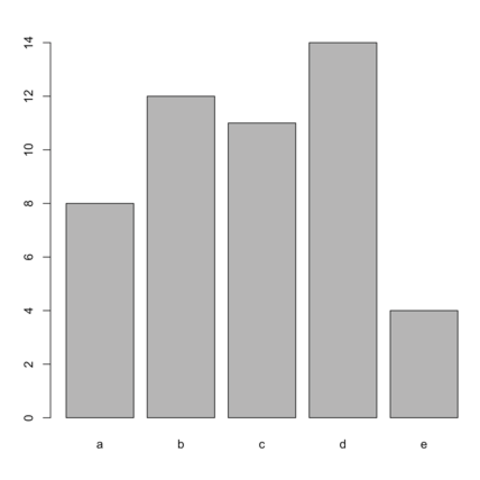
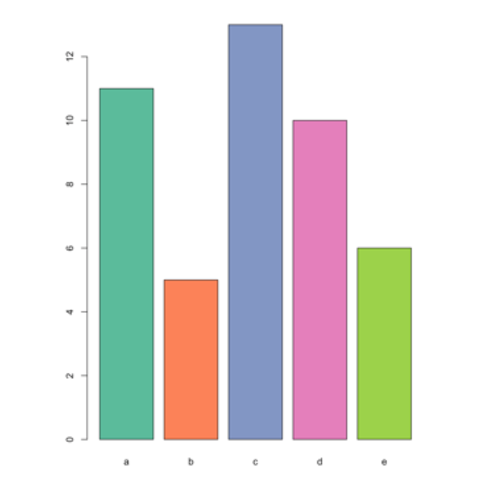
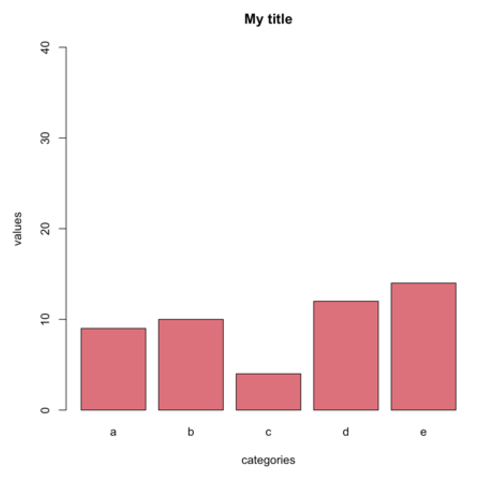
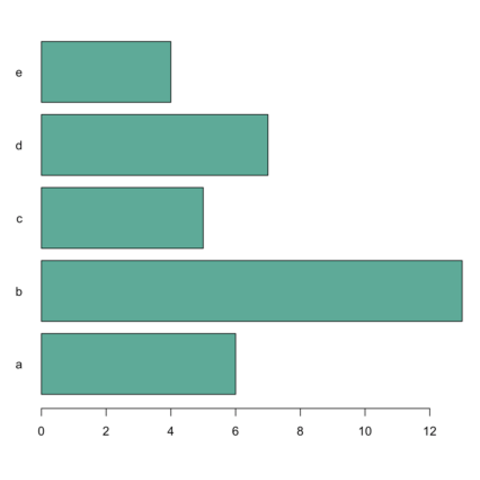
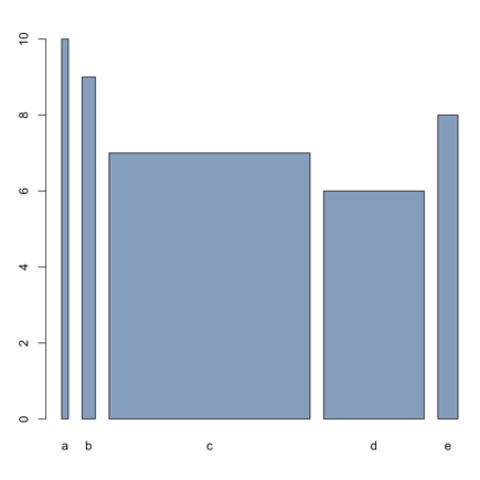
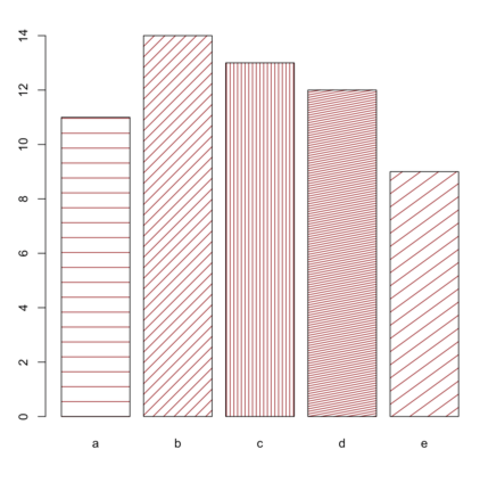
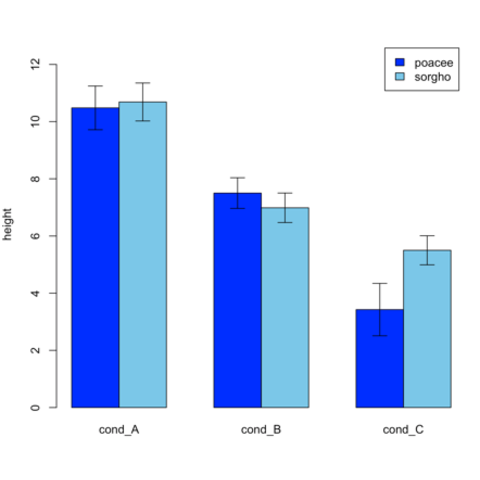
Base R and the
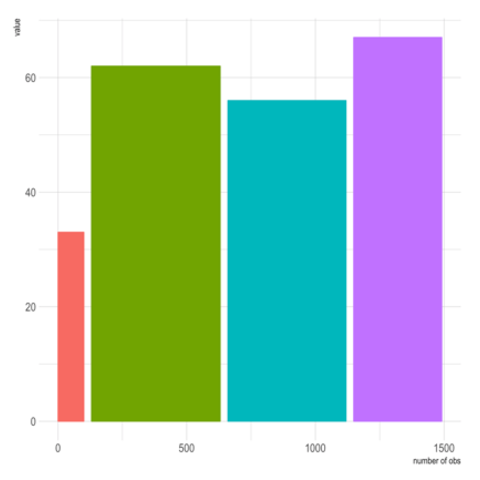
barplot() functionBasic R can build quality barplots thanks to the barplot() function. Here is a list of examples guiding you through the most common customization you will need.