Home
DBSCAN Clustering
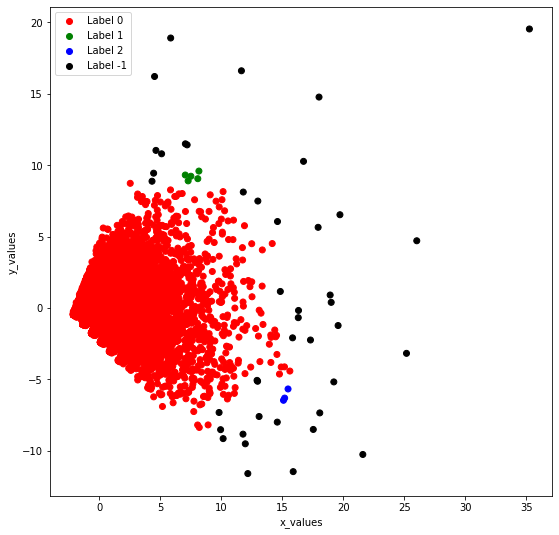
DBSCAN Clustering Output
DBSCAN Clustering Output
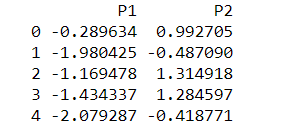
Numpy array of all the cluster labels assigned to each data point:
Plotting P1 on the X-Axis and P2 on the Y-Axis according to the colour vector defined: