A few notes on chord
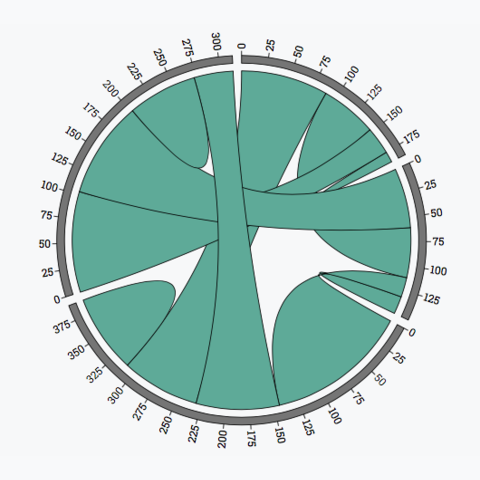
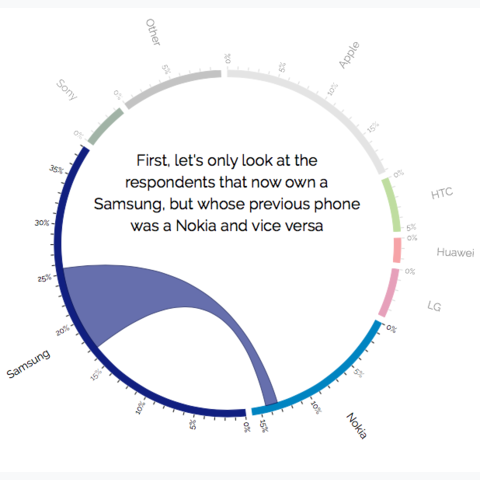
Chord diagram is probably one of the most difficult graph to build with d3. Here are a few reminders:
- Everything relies on the d3.chord() function. This function takes as input a square matrix of flow. The output is an array of chords.
- Each chord as a source and a target. For each group it gives info like the angle of start and end, the flow value, the node index,
- It's important to understand that a chord diagram is composed by 2 elements: the links, and the nodes. Nodes are like a donut plot
- The nodes are drawn using the arc() function. The links with the ribbon function().
Step by step
Best Blocks


