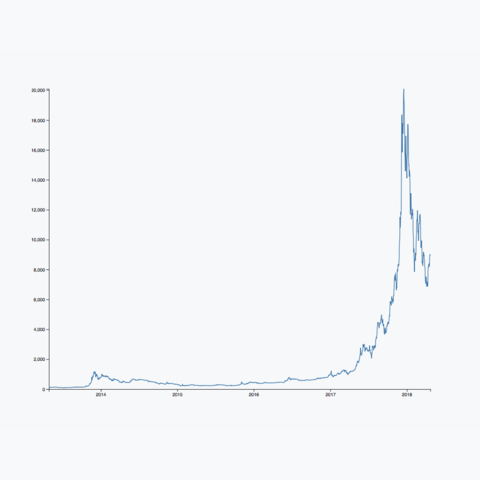
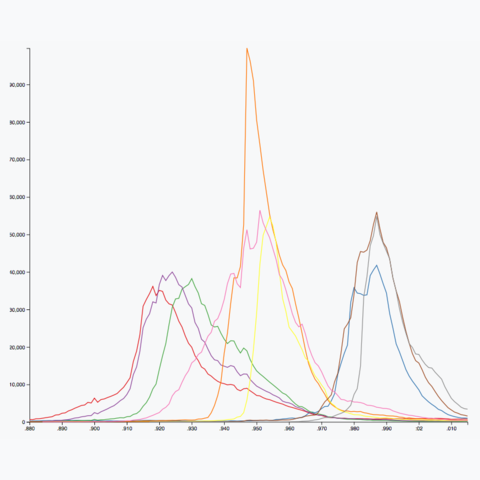
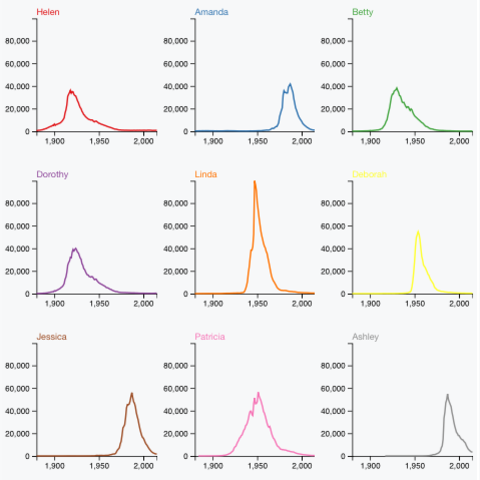
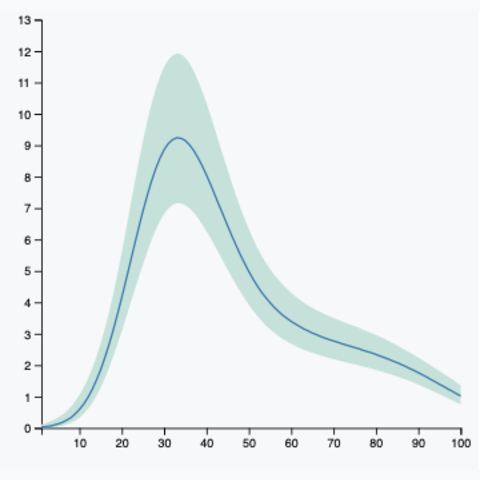
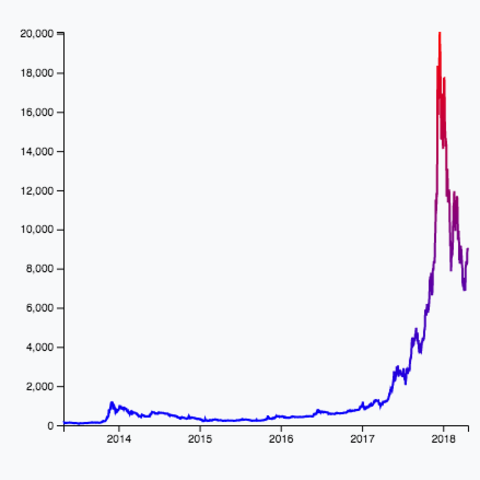
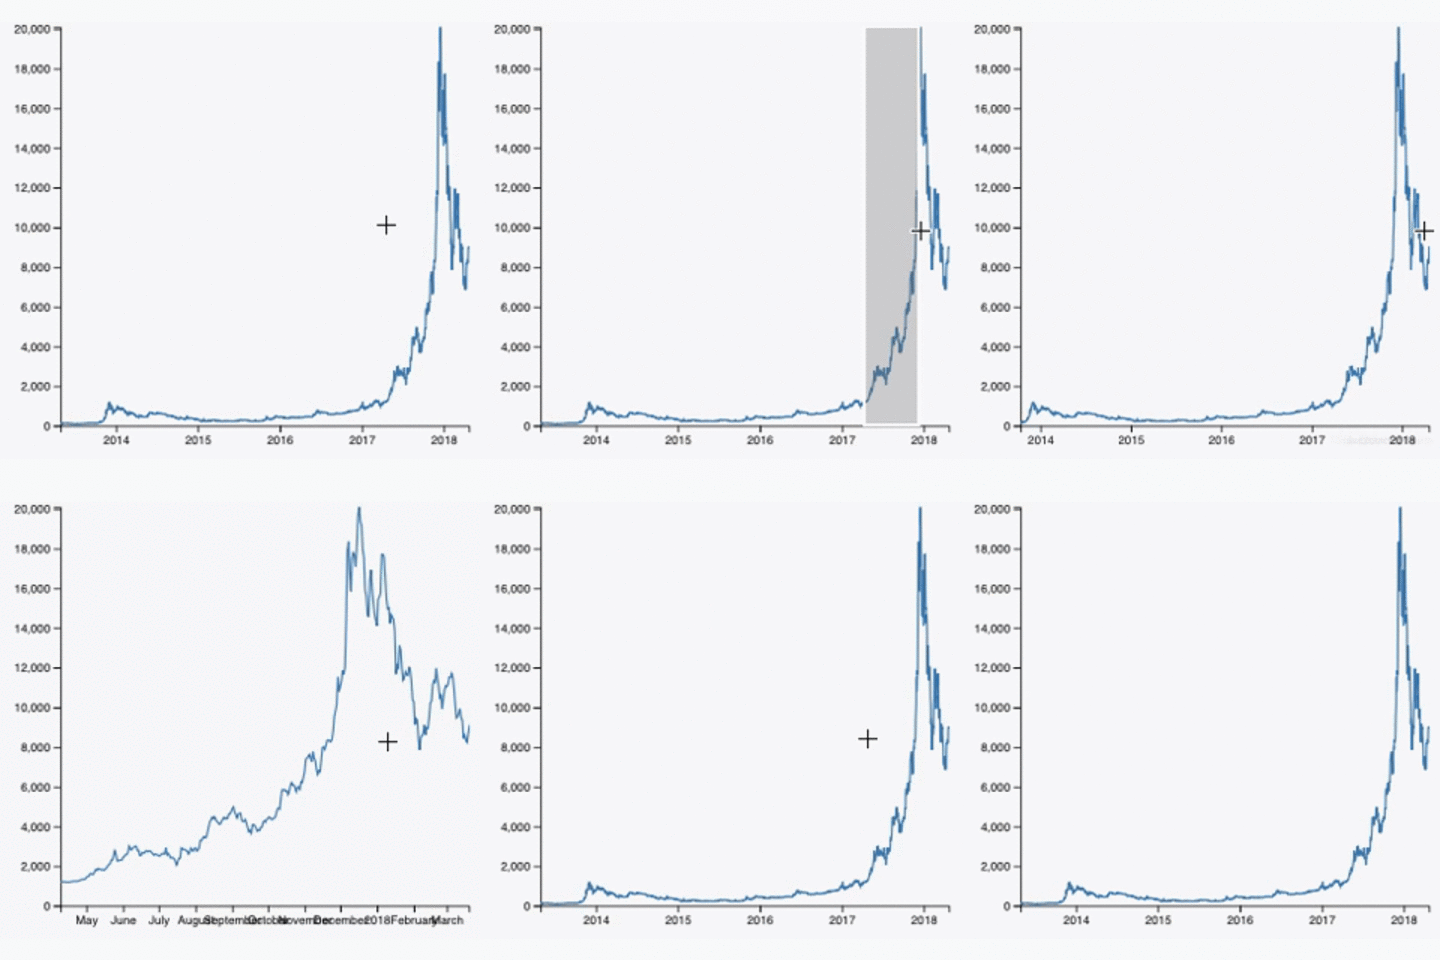
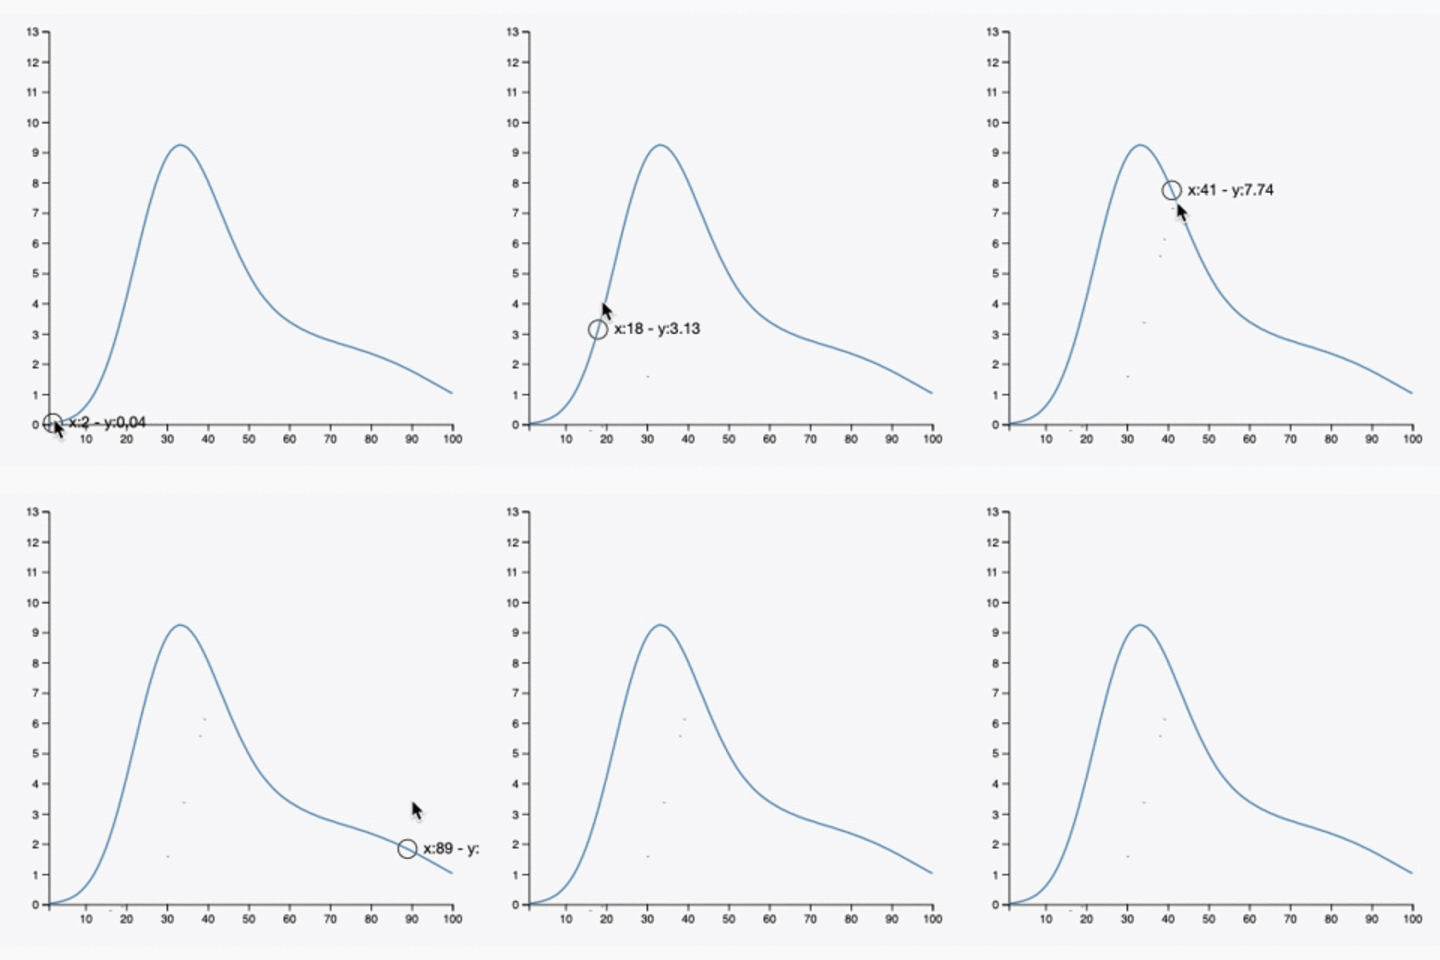
Line chart are built thanks to the d3.line() helper function. I strongly advise to have a look to the basics of this function before trying to build your first chart. First example here is the most basic line plot you can do. Next one shows how to display several groups, and how to use small multiple to avoid the spaghetti chart.
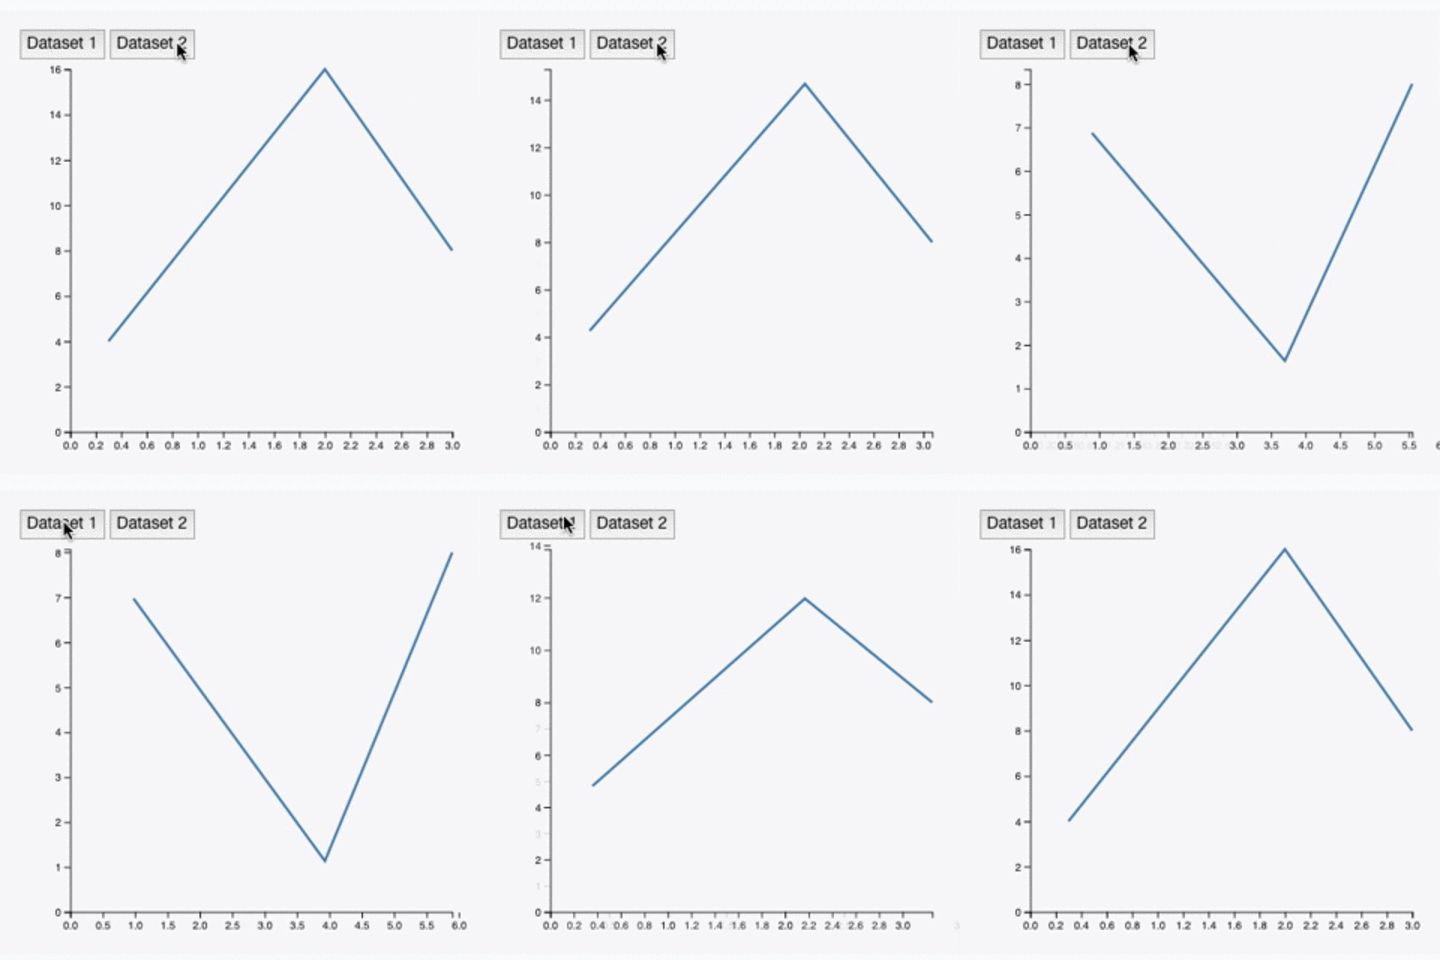
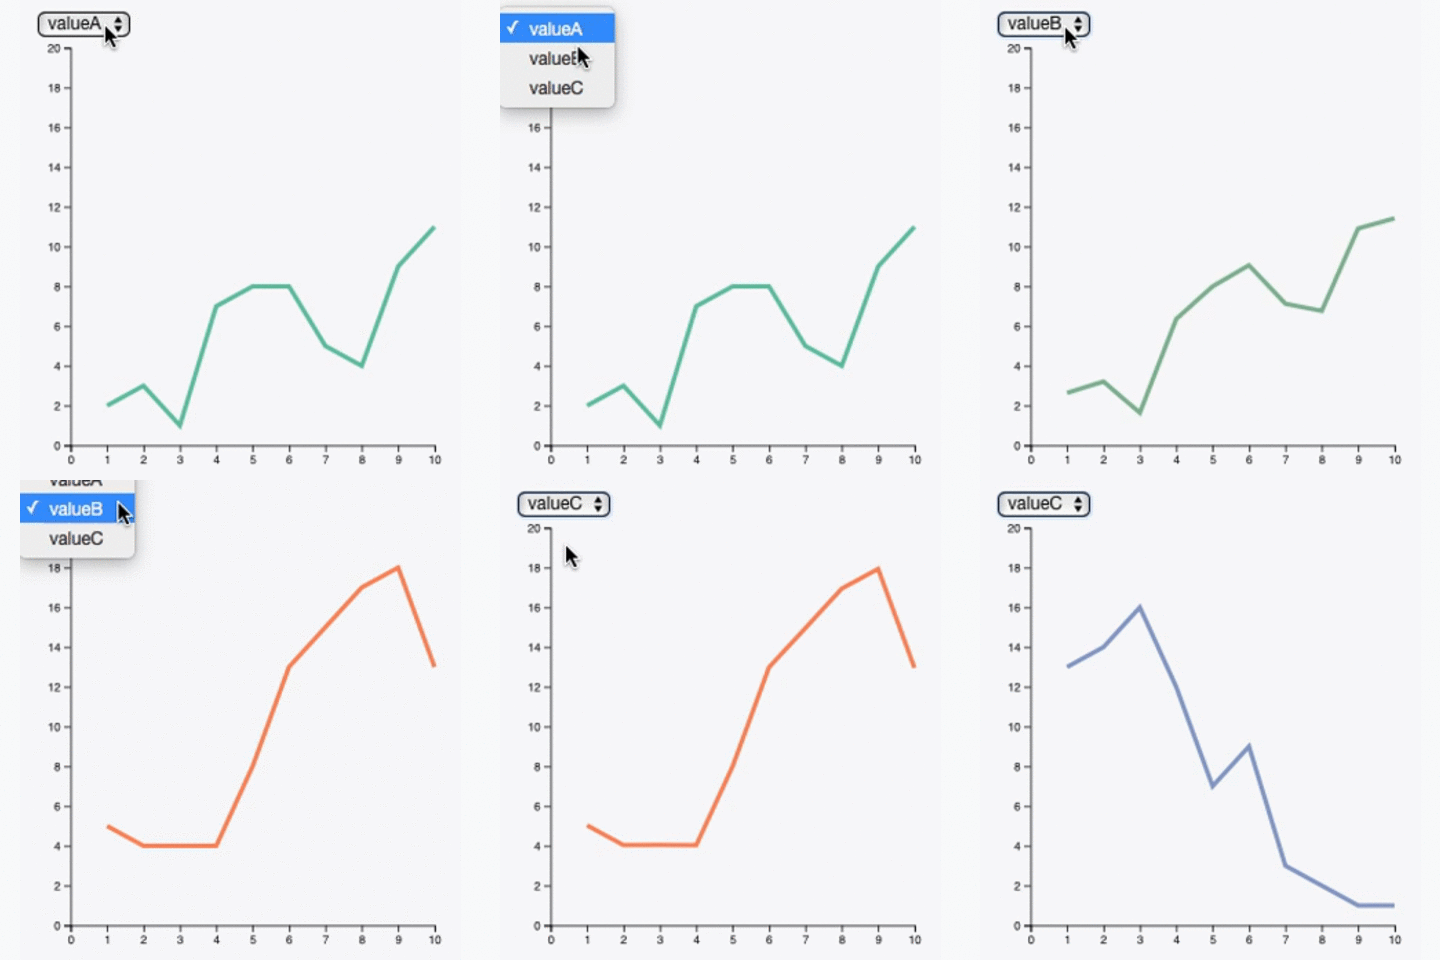
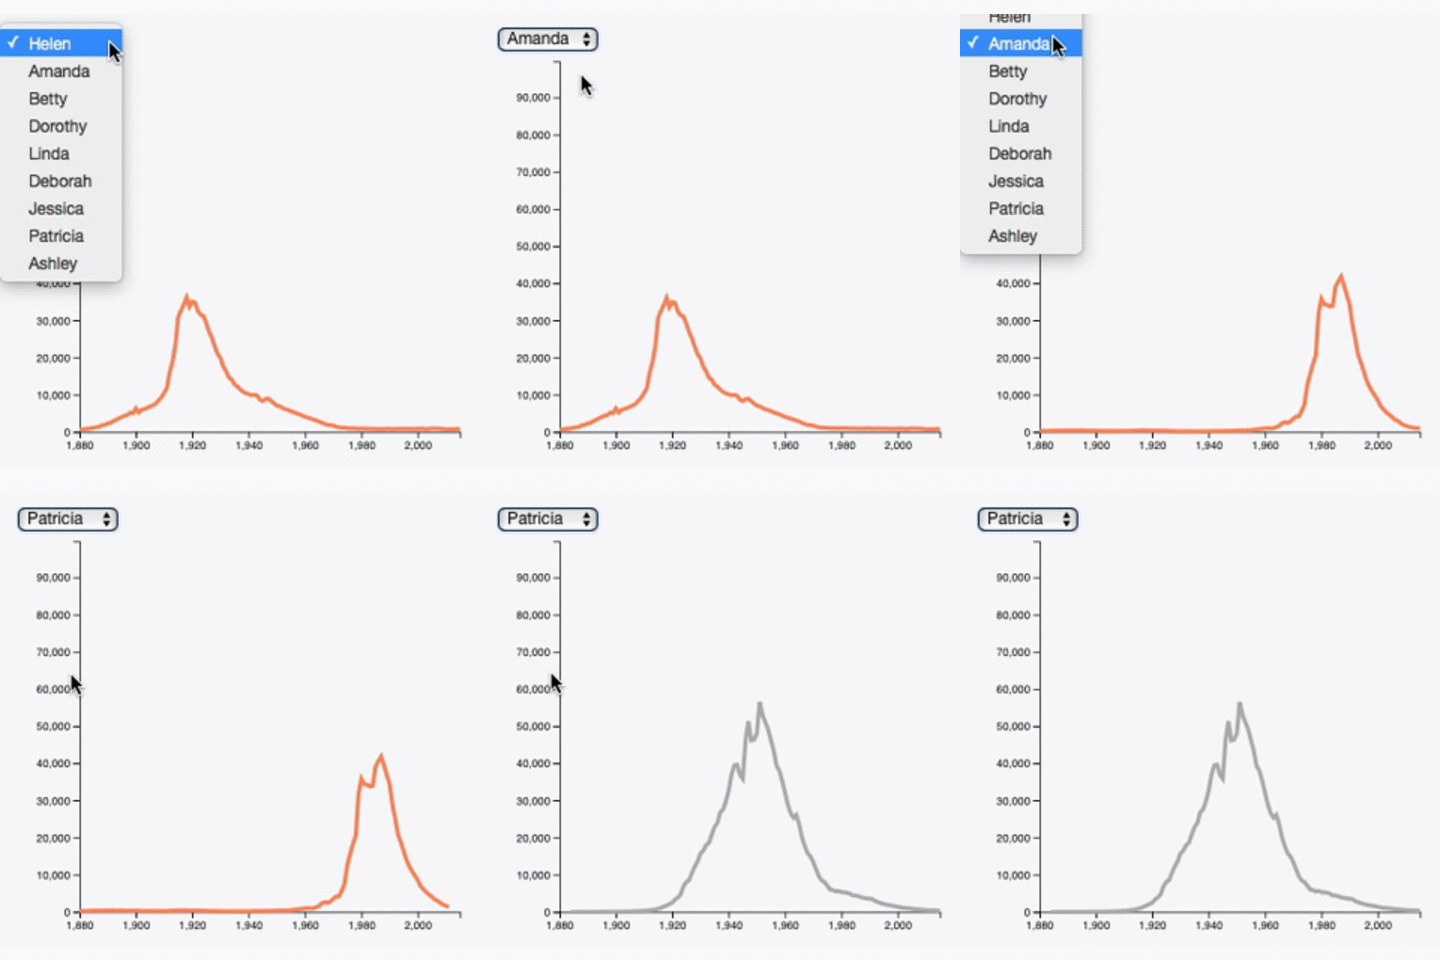
Three examples showing how to switch from one data series to another with smooth transition. Three situations are described. 1/ series are stored in different input file. 2/ series are stored in the same dataset, each in a different columns (wide format). 3/ same dataset, same column: long or tidy format.
Interactivity can also be useful to zoom on a part of the chart or highlight a specific set of the chart
