Menu Path : Monitoring>REST Clients>REST Client Details |
Read Access Rights:
|
Write Access Rights:
|
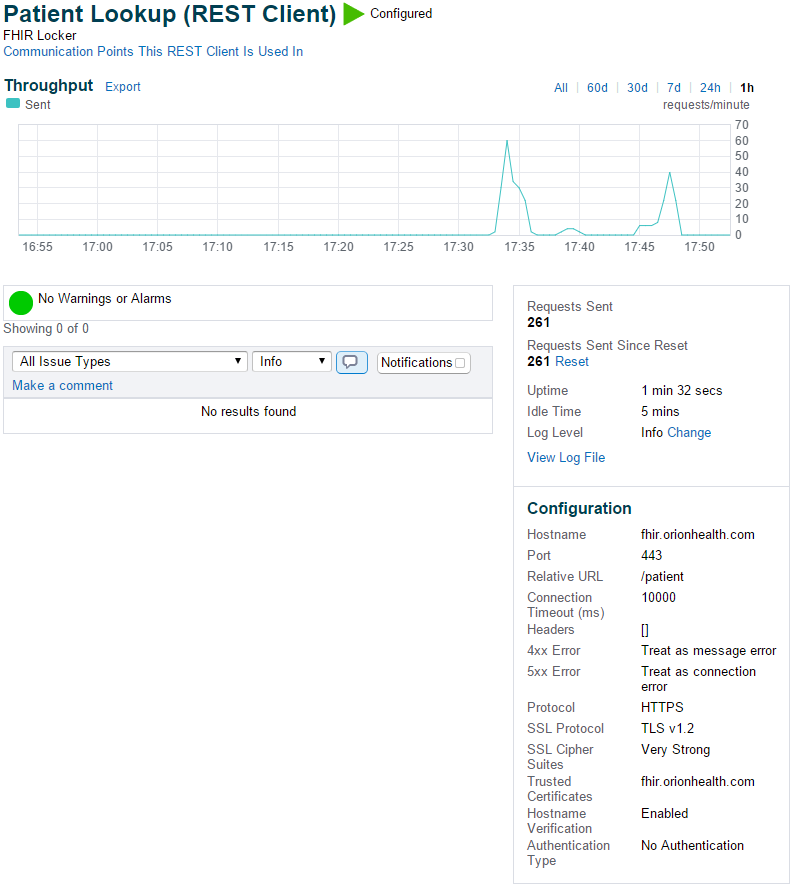
The REST Client Details page displays details and statistics for a REST Client. It consists of the following panels:
Overview
Field/Action |
Description |
|---|---|
Name |
The name of the REST client. |
Status |
REST client can take on the following states:
|
Communication Points This REST Client Is Used In
|
Field |
Description |
|---|---|
Communication Point |
Identifies the communication points that use this REST Client and their current status (started or stopped). Click the communication point's name to display the Communication Point Details page. |
Mode |
Identifies the operational mode of the communication point. |
Status |
For each communication point the following information is displayed:
You must stop the communication point to view messages on the inbound and outbound queues. |
Throughput
The graph displays the messages that have been sent, received and failed on a communication point over time. This enables you to monitor and view processing trends, for example, message spikes. You can alter the display period of the graph as follows:
- All - displays all processed messages.
- 60d - displays messages processed in the last 60 days.
- 30d - displays messages processed in the last 30 days.
- 7d - displays messages processed in the last 7 days.
- 24h - displays messages processed in the last 24 hours.
- 1h - displays messages processed in the last 1 hour.
To zoom, click and drag on the graph.
The Advanced button enables you to show or hide the Failed line graph. It is disabled by default.
Exporting Statistics
To export throughput statistics for individual REST Clients or all statistics for the system:
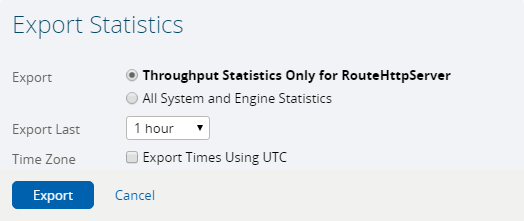
Click the Export link next to Throughput to display the Export Statistics dialog:
Select one of the following radio buttons:
Option
Description
Throughput Statistics Only for <REST Client name>
Only exports statistics for a specific REST client.
All System and Engine Statistics
Exports all statistics types for the system.
- Select the collection time period of statistics you want to export from the Export Last drop-down list.
Select the Export Times Using UTC checkbox if you want to export the data using Coordinated Universal Time as the time zone.
If this option is not selected, the data is exported using the local time of the Rhapsody engine, which could potentially result in time discrepancies, if a daylight saving changeover occurs during the period the statistics were collected.
- Click the Export button to export the data to a zipped CSV file.
Details and Statistics
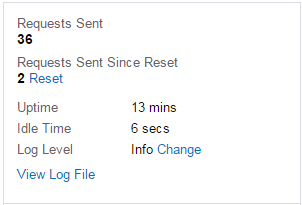
The Details and Statistics panel displays message details and statistical information:
Field/Action |
Description |
|---|---|
Requests Sent |
A count of the requests sent by the REST client since it was created and started for the first time. |
Requests Sent Since Reset |
A count of the requests sent by the REST client since the count was reset. To reset the requests count to zero, click the Reset link. |
Idle Time |
The period of time (in seconds, minutes, hours or days) since a request was last processed by the REST client. |
Up Time |
The period of time (in seconds, minutes, hours or days) since the REST was last modified via check-in, or the engine was restarted. |
Log Level |
The log level for this route. Click the Change link to select a log level from the drop-down list. You can select from the following log levels:
Refer to Logging Levels for details. |
View Log File |
Click the View Log File link to display the log file for the REST client. Refer to System Log for details. |
Configuration
The Configuration panel displays the configuration properties for this REST client, defined on the Configuration tab of the REST client Properties dialog in Rhapsody IDE. Each REST client has a different set of properties depending on the information it requires.


