Menu Path : Monitoring>System Monitor |
Read Access Rights:
|
Write Access Rights:
|
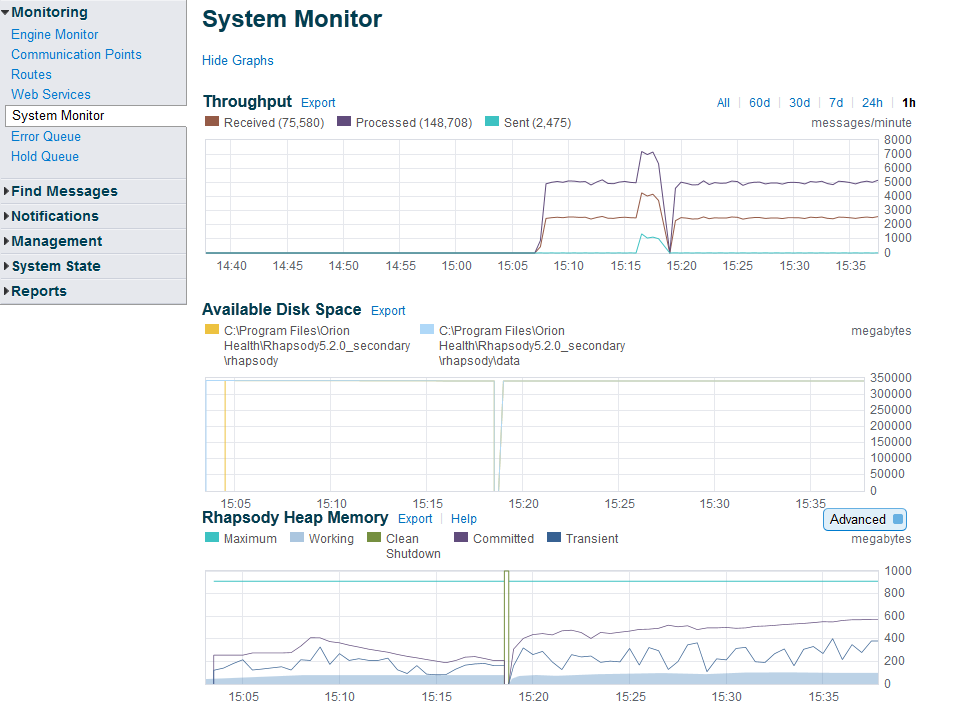
The System Monitor page displays a graphical history of the engine's message throughput, disk space usage and memory usage, over a configurable time period.
It consists of the following panels:
Panels |
Description |
|---|---|
Throughput |
A line graph showing the Received, Processed, Sent and Failed messages which passed through all the components in the engine. |
Available Disk Space |
A line graph showing the disk space available in the engine. |
Rhapsody Heap Memory |
Line graphs showing the Rhapsody Heap memory usage in the Rhapsody engine.
The Advanced button enables you to show or hide the Committed and Transient line graphs. It is off by default. |
Displays all current issues that relate specifically to the engine itself. Issues for individual components can be viewed on their own respective pages. |
|
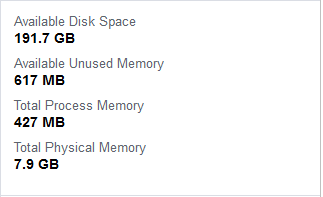
A summary of memory usage statistics for the engine. |
|
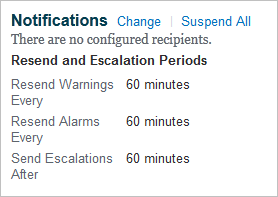
Displays a read-only list of all recipients and enables you to set up custom notification preferences for the selected component. |
|
Enables you to set up custom thresholds for the selected component. |
System Performance
The graphs are designed to show statistical trends of the engine's message throughput, disk space and memory usage, over a configurable time period, based on a statistics retention policy.
The graph plots are color-coded to distinguish between the different options in a graph. For example, in the Throughput graph, the different trace colors refer to received, processed, sent and failed messages. Place your mouse pointer over any portion of the display trace to see the value at that point in time.
You can alter the display period of the graphs as follows:
- All - displays a sample of values since Rhapsody was first used.
- 60d - displays a sample of values for the last 60 days.
- 30d - displays a sample of values for the last 30 days.
- 7d - displays a sample of values for the last 7 days.
- 24h - displays a sample of values for the last 24 hours.
- 1h - displays a sample of values for the last 1 hour.
Certain statistical details may not be displayed in the graphs depending on the zoom resolution. To zoom in and display a graph in finer detail, click and drag on the map. All graphs are synced with the selection.
Click the Hide Graphs link to hide the graphs. Click the Show Graphs link to view the graphs.
Statistics Retention Policy
Rhapsody observes the following statistics retention policy:
- Statistics collected for the last day are kept at 30-second intervals.
- Statistics collected for the last week are kept at 5-minute intervals.
- Statistics collected for the last 30 days are kept at 30-minute intervals.
- Statistics collected beyond 30 days are kept at 6-hour intervals.
System Health
A healthy system generally satisfies the following conditions:
Recommendation |
Justification |
Resolution |
|---|---|---|
The working memory level should remain below the red threshold. |
The working memory represents the amount of memory in use by Rhapsody after a full garbage collection. As such, if this remains at a high level, the chance of an Out of Memory error occurring in Rhapsody due to a sudden spike in workload increases (as there is less available memory before the maximum heap is reached). |
If the working memory consistently remains above the threshold, then it is likely you will need to increase the maximum heap allocation. Ideally, the working memory series should remain between 40% and 70% of the maximum series. |
There should be no Garbage Collection (GC) pauses. |
Only GC pauses in excess of 10 seconds are displayed on the memory graph. A GC pause results in all application processing being put on pause until the GC pause completes. Therefore, long pauses have a significant performance impact on application processing. |
Long GC pauses are generally the result of a sub-optimal Rhapsody heap configuration and/or insufficient physical memory on the system to accommodate Rhapsody's needs, which in turn results in page-swapping and consequent disk I/O operations. Ensure that there is sufficient dedicated physical memory on the system to accommodate Rhapsody, the OS and all other applications on the system. |
There should be no unclean shutdowns. |
Unclean shutdowns indicate an error in the Rhapsody application or JVM, or an unexpected termination of the OS. The cause of unclean shutdowns must be investigated to eliminate unexpected production outages. |
Examine the Rhapsody and OS logs in order to determine the cause of the unclean shutdown. |
The amplitude of the transient memory graph should ideally be less than 30% of the maximum memory. |
Large fluctuations in the minima and maxima of the transient series indicate a sub-optimal Rhapsody heap configuration with less frequent garbage collection. This can result in longer GC pause times as well as a more fragmented Rhapsody heap, which both contribute to detrimental performance in application processing. |
Ensure that the maximum heap size of Rhapsody is configured such that the working series sits between 40% and 70% of the maximum memory during periods of low and high workload, respectively. |
Garbage Collection Log Data
The wrapper log is a log file generated by the wrapper service which is responsible for launching Rhapsody. It contains the following:
- Log entries written by the wrapper service.
- GC log information.
By default, Rhapsody captures Garbage Collection (GC) log data and writes it out to the wrapper.log files. These log files are then used by the Rhapsody engine to persist data regarding garbage collection behavior in Rhapsody.
Both the log files and the capture of this data can be configured in the wrapper.conf file which is located in: <APPLICATION_HOME/bin>. The following fields can be modified in order to modify the logging behavior:
wrapper.java.additional.12=-verbose:gc- Removing this disables the gathering and persisting of GC information.set.WRAPPER_LOG_LOCATION=log/wrapper.log- The value of this variable is used to set the log location.wrapper.logfile.maxsize=20m- This value determines the size of the wrapper log files before they wrap.wrapper.logfile.maxfiles=10- This value determines the number of wrapper log files which will be kept. The naming convention of the log files is as follows:<filename>.<n>wherenincreases with older log files.
Exporting Statistics
To export disk space, memory usage or throughput statistics for the system (or all statistics for the system):
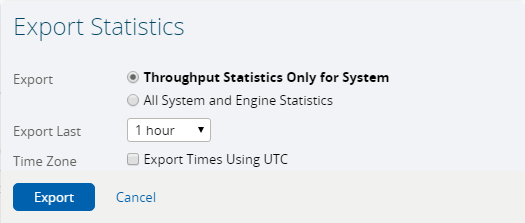
Click the Export link next to the respective graph to display the Export Statistics dialog:
Select one of the following radio buttons:
Option
Description
<field name> Statistics Only for System
Only exports the statistics from an individual field for the system.
All System and Engine Statistics
Exports all statistics types for the system and engine.
- Select the collection time period of statistics you want to export from the Export Last drop-down list.
Select the Export Times Using UTC checkbox if you want to export the data using Coordinated Universal Time as the time zone.
If this option is not selected, the data is exported using the local time of the Rhapsody engine, which could potentially result in time discrepancies, if a daylight saving changeover occurs during the period the statistics were collected.
- Select the Export button. This exports the data to a zipped CSV file.
Activity Feed
The Activity Feed is divided into two panels:
Current Issues
The Current Issues panel displays all the current issues for the selected component, for example:
| Element | Description |
|---|---|
| Alert Severity | Indicates the level of severity (alarm or warning). |
| Issue | The name of the issue raised |
| Time | The date and time the alert was raised, and how long ago. |
| Actions | Clickable links that you can use to act upon the issues. |
Managing Current Issues
Use the following actions to manage current issues:
Action |
Description |
|---|---|
Comment |
Click the Comment link to enter a comment for the issue. |
Previously Resolved |
Click the link to filter the activity feed to display only the related historical resolved issues. This link will only show for Numerical Issues. The number represents the number of issues of the same type which are in the historically resolved part of the Activity Feed. |
Dismiss Alert |
Click the link to Dismiss the issue and enter a comment in the text box. Numerical Issues also have the option to Suspend Notifications, where you can enter the time in minutes to suspend notifications for the "Issue" (not "Issue Type"). For a Non-Numerical Issue, clicking Dismiss will move it immediately to the Historical Issues section. Clicking the Dismiss link for a Numerical Issue will mark it as "Dismissed". Rhapsody will continue to check the threshold until the issue is resolved. Once the issue is resolved, it will move to the Historical Issues section. Until the issue is resolved it will stay in the Current Issues. If the severity of the issue increases, for example from "Warning" to "Alarm", the issue will no longer appear as "Dismissed". Refer to Working with Issues for details. |
Reactivate Alert |
Click the link to cancel the "Dismissed" state, thus Reactivating the severity of the issue. Refer to Working with Issues for details. This link will only appear for Numerical Issues that are currently "Dismissed". |
Suspend Notifications |
Click the link and enter a Suspend Notification time in minutes to suspend notifications for the "Issue" (not "Issue Type"). |
Resume Notifications |
Click the link to Resume Notifications for the "Issue" (not "Issue Type"). This link will only appear when notifications for this issue are currently suspended. |
Assign |
Click the link and select a user to assign the issue to. |
Activity |
Click the Activity link to show or hide the activity for the specific issue. The number represents the number of items that will be shown. |
Because the system may be updating the state of an issue while you are in the process of performing an action on it, the system will occasionally not let you perform the action without first reviewing the changes that have happened. In this case, it will ask you to refresh the page and try the action again. You may wish to copy the text of any comment you have entered to your clipboard so that you can then have the option of pasting it after you have refreshed the page.
Historical Issues
The Historical Issues panel displays all the current issues for the selected component, for example:
| Element | Description |
|---|---|
| Filters | Clickable links that you can use to filter the list of displayed issues. |
| Alert Severity | Indicates the level of severity (alarm or warning). |
| Issue | The name of the issue raised |
| Time | The date and time the alert was raised, and how long ago. |
| Actions | Clickable links that you can use to manage the issues. |
Filtering Historical Issues
Use the following filters to filter historical issues:
| Filter | Description |
|---|---|
| Issue Types | The issue types to filter on. |
| Log Level | The issue types to filter on. |
| Show/Hide Comments | Toggle the Comments icon to view all comments relating to the Activity Feed. This does not filter comments placed against an issue. |
| Notifications | Toggle the Notifications button to view all or none of the following entries in the Activity Feed:
This shows notifications in both the Current Issues and Historical Issues panels. |
Managing Historical Issues
Use the following actions to manage historical issues:
Action |
Description |
|---|---|
Make a comment |
Click the Make a comment link to add a comment to the Activity Feed. |
| Comment | Click the Comment link next to a historical issue to comment on that specific issue. |
| Activity | Click the Activity link next to a historical issue to show or hide the activity for this issue. The number represents the number of items that will be shown. |
| Show error details | Click the Show error details link next to a historical issue to show the stack trace of any error. |
Memory Usage Statistics
The Memory Usage Statistics panel displays a summary of the Rhapsody Engine's memory usage enabling you to view, at a glance, basic details about the engine:
Field |
Description |
|---|---|
Available Disk Space |
The available disk space. |
Available Unused Memory |
The free memory available. |
Total Process Memory |
The total physical and virtual memory in use by Rhapsody(includes de-referenced memory that has not yet been garbage collected). |
Total Physical Memory |
The total RAM on the system. |
Notifications
The Notifications panel displays a read-only list of all recipients (users, watchlists, emails or SNMP).
Click the Change link to display the Change Notification dialog where you can set up custom notification preferences for the selected component and override the default set up on the Default Notification Settings page.
When you click the Change link to edit the list of recipients who will receive notifications, it only applies to the selected component.
To edit a watchlist notification preference, click the watchlist name to display the watchlist details.
- Click the Suspend All link to suspend all the notifications for the selected component. When you suspend notifications for the selected component an information banner is displayed above the Activity Feed:
Click the Resume Notifications link to resume notifications for the selected component. Refer to Suspend / Resume All Notifications for details.
To avoid an overload of notifications after engine start-up, notifications are suppressed for the first five minutes after the engine is started. You are notified of when notifications have been enabled through the activity feed with the log entry: Starting the notification resender.
Custom Thresholds
The Custom Thresholds panel displays a list of custom thresholds for notifications (warnings and alarms) and allows you to customize them.
Click the Change link to display the Change Thresholds dialog where you can setup threshold values:
Issue |
Description |
Default Value | |
|---|---|---|---|
| Warning | Alarm | ||
Large Communication Point Queue (messages) |
When the number of messages in either the input or output queue of any communication point is higher than the selected value. |
1000 | 10000 |
Large Route Queue (messages) |
When the number of messages in the processing queue of any route is higher than the selected value. |
1000 | 10000 |
Large Error Queue (messages) |
When the number of messages currently in the Error Queue is higher than the selected value. |
50 | 200 |
Large Hold Queue (messages) |
When the number of messages currently in the Hold Queue is higher than the selected value. |
50 | 200 |
Low Data Directory Disk Space (MB) |
If the hard drive space available for the Rhapsody data directory drops below the selected value. |
10240 | 6144 |
Low Install Directory Disk Space (MB) |
If the hard drive space available for the Rhapsody installation directory drops below the selected value. | 5120 | 3072 |
Low JVM Memory (MB) Average over <n> mins |
If the JVM memory available drops below the selected value, on average over the time period specified. |
128 | 64 |
High Working Memory (%) |
When Rhapsody's working memory exceeds the selected percentage of Rhapsody's maximum memory. |
75 | 85 |
Long GC Pause (secs) |
When a Garbage Collection pause lasts longer than the selected value. |
10 | 30 |
| Old live error queue messages | When Archive Cleanup detects the Error Queue requires defragmenting. | Warning | |
High CPU Usage (mins) at Minimum <n> % |
If the percentage of CPU usage exceeds the selected value, on average over the time period specified. This only reports the CPU usage by the Rhapsody process, not the overall CPU usage of your system. |
5 | 15 |
Communication Points Stopped Due To Low Space |
If Rhapsody stops communication points due to the available disk space falling below the specified minimum (which, by default, is set to 2 GB). |
Alarm | |
Routes Stopped Due To Low Disk Space |
If Rhapsody stops routes due to the available disk space falling below the specified minimum (which, by default, is set to 2 GB). |
Alarm | |
Backup Failed |
If a backup you have scheduled fails to start. This happens if multiple backups have been scheduled to run at the same time, or a backup is running when another backup is meant to start. |
Alarm | |
Rhapsody Starting |
Every time Rhapsody is restarted. |
Warning | |
Configuration Changed |
When a user changes any component of the configuration and checks in that change through Rhapsody IDE or the REST API. |
Warning | |
| Custom Library Changed | When a user loads or deletes any third party libraries through Rhapsody IDE or the REST API. | Warning | |
| Custom Module Changed | When a user loads or deletes any custom modules through Rhapsody IDE or the REST API. | Warning | |
|
SSL Certificate Expiry (days)
|
When an SSL certificate used within Rhapsody is close to expiring or expired. This includes certificates installed by the user via the Rhapsody IDE, and certificates used by Rhapsody internally (for example, for accessing the Management Console using HTTPS). |
30 | 14 |
| Upcoming Rhapsody License Expiry (days) | When a valid Rhapsody license is close to expiring or expired. Additionally, a Rhapsody license expiry banner is displayed. |
14 | 7 |
REST API call rejected due to too many incoming requests |
When Rhapsody receives more than a certain number of REST API requests within a specified time. Refer to Excessive Calls for details. |
Warning | |
Select the Yes button and then, depending on the type of notification, select the Warning or Alarm button to raise an issue for the system or enter the appropriate threshold values in the Warning and Alarm fields. Select the No button if you do not wish to raise a warning or alarm for an issue for the system.
Click the Add Time Period link to set the time scale to be applied to the threshold for the component:
- To apply the time period, select a time period from the drop-down list and select the Apply button.
- To remove the time period, select a time period you want to remove from the drop-down list and click the Remove Selected Period link.


