Use values without scaling
Use this set of scales when your data has already been scaled, i.e. it
already represents aesthetic values that ggplot2 can handle directly
This will not produce a legend unless you also supply the breaks
and labels.
scale_colour_identity(..., guide = "none")

scale_fill_identity(..., guide = "none")

scale_shape_identity(..., guide = "none")

scale_linetype_identity(..., guide = "none")

scale_alpha_identity(..., guide = "none")

scale_size_identity(..., guide = "none")
Arguments
| ... | Other arguments passed on to |
|---|---|
| guide | Guide to use for this scale. Defaults to |
Examples
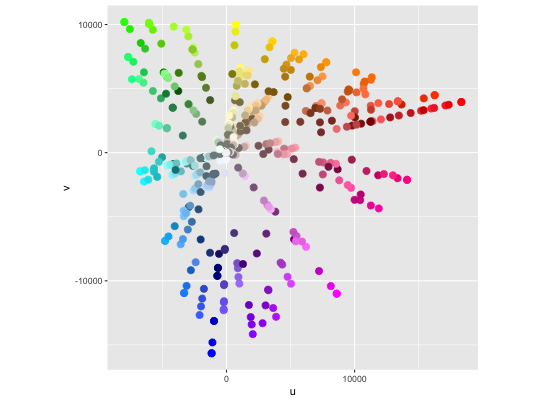
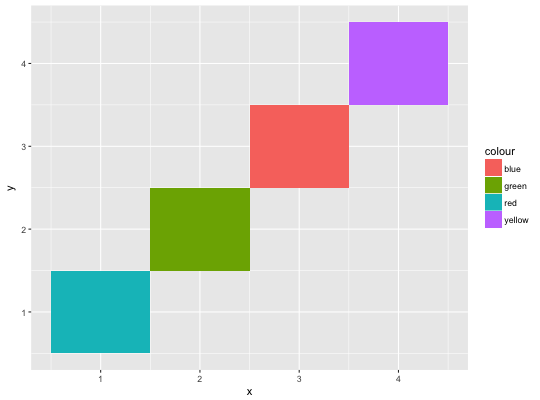
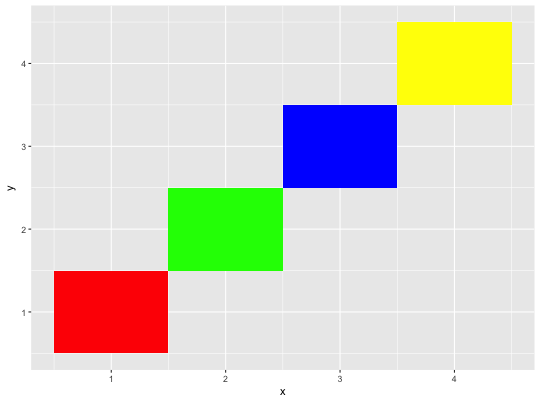
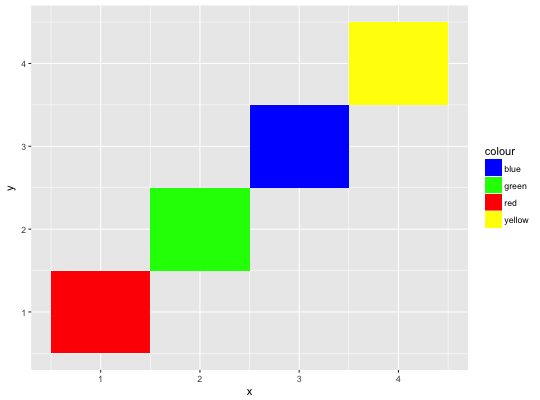
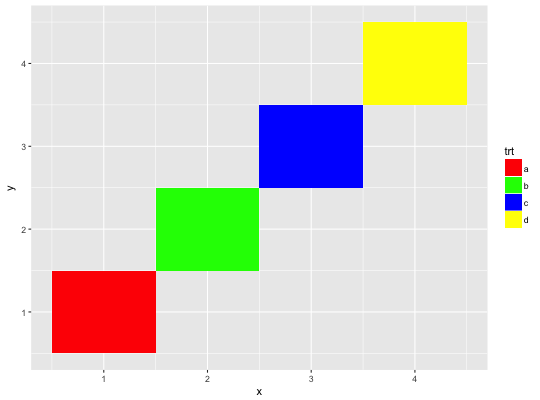
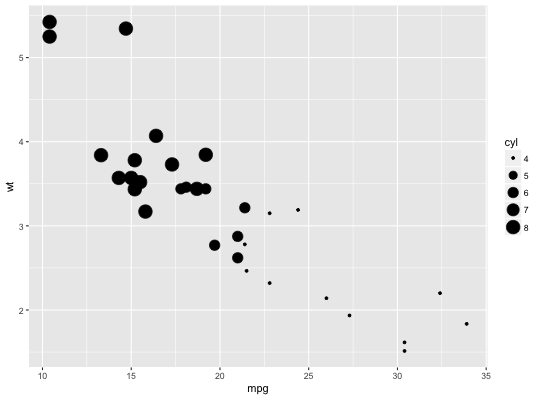
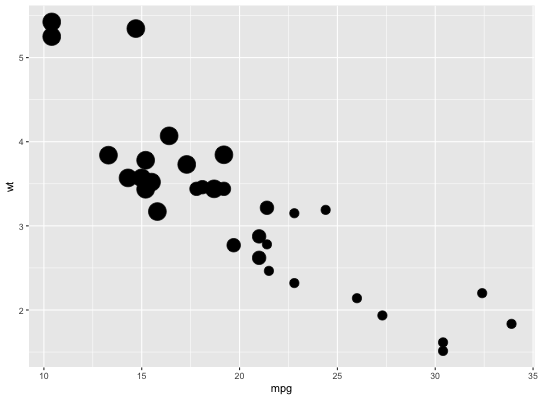
ggplot(luv_colours, aes(u, v)) + geom_point(aes(colour = col), size = 3) + scale_color_identity() + coord_equal()df <- data.frame( x = 1:4, y = 1:4, colour = c("red", "green", "blue", "yellow") ) ggplot(df, aes(x, y)) + geom_tile(aes(fill = colour))# To get a legend guide, specify guide = "legend" ggplot(df, aes(x, y)) + geom_tile(aes(fill = colour)) + scale_fill_identity(guide = "legend")# But you'll typically also need to supply breaks and labels: ggplot(df, aes(x, y)) + geom_tile(aes(fill = colour)) + scale_fill_identity("trt", labels = letters[1:4], breaks = df$colour, guide = "legend")# cyl used as point size ggplot(mtcars, aes(mpg, wt)) + geom_point(aes(size = cyl)) + scale_size_identity()