About Survey Two:
Survey Design
The second Library Simplified survey was a 10-minute web survey designed to expand the findings from survey one; provide data specific to NYPL boroughs; and draw comparisons between users and non-users.
Sample Data and QualityA third party vendor, Survey Sampling International (SSI), programmed, hosted and managed the survey. SSI used a blind, unbranded invite. Timestamps and data checks were used while the study was in field to identify and remove speeders and straight-liners. However, this does not mean that responses are precise; self-reported behaviors are often overstated and should not be misconstrued as accurate frequencies.
Sample Plan- Sample Size: 319 completes (originally 300, but vendor provided extra sample)
- Respondent Requirements: Must live in NYC boroughs of Manhattan, Staten Island, or the Bronx (While some NYPL users reside outside of our boroughs, residency was the most effective screening criterion to ensure a qualified sample.)
- Quotas
- eReaders: min. n = 100; Respondents who have read at least one eBook in the past year
- Library Users: min. n = 100; Respondents who have used a public library in the past year
Summary
Library Users vs. Non-Users
- On average (arithmetic mean using midpoints), library users report reading about 50% more books than non-users; however, the mode for both populations is 1 – 10 books
- Library users more strongly associate themselves with books and reading than non-users, particularly regarding the role of books in their social lives
- Library users read more genres than non-users
- A significantly greater proportion of library users read fiction, biography, classics, fantasy, and historical fiction, among others
- Frequency of reading across formats is positively correlated with library usage
- An exception to this is low-frequency library users, ~2/3 of whom are frequent eReaders
- Library users prefer print and eBooks for different occasions, while print is favored by the majority of non-users across occasions (largely because fewer read eBooks at all)
- The majority of both library users and non-users prefer to buy books rather than check them out from the library
- Buying online is the overwhelming favorite for eBooks
- Likewise, online bookstores are a key source of recommendations for library users and non-users
- In general, library users also seek recommendations from more sources than non-users
- The main reason non-users cite for not using a library is that they prefer to buy their books, both in physical bookstores and online
- The majority of respondents who were library users were also eReaders; because of this, data about library users in the previous section is generally also true of eReaders
- On average (arithmetic mean using midpoints), eReaders report reading more than 2x as many books as non-eReaders; the mode for both populations is 1 – 10 books
- Genres like romance, science, historical fiction, and fantasy / science fiction are read by a significantly greater proportion of eReaders than non-eReaders
- Buying online is the most popular way to access new eBooks
- Of those that use digital subscription services, Oyster is the most popular
- eReaders read to keep up with current events, for work, and for research more than non-eReaders; they also read more non-book media in electronic formats
- eReaders indicate a preference for browsing to find their eBooks, using features like cover jackets, ratings, and recommendations
- While behaviors may be overstated, the data indicates that consumption of eBooks across multiple devices is common practice among eReaders
- The most common devices owned by eReaders are the Kindle, iPhone, and iPad
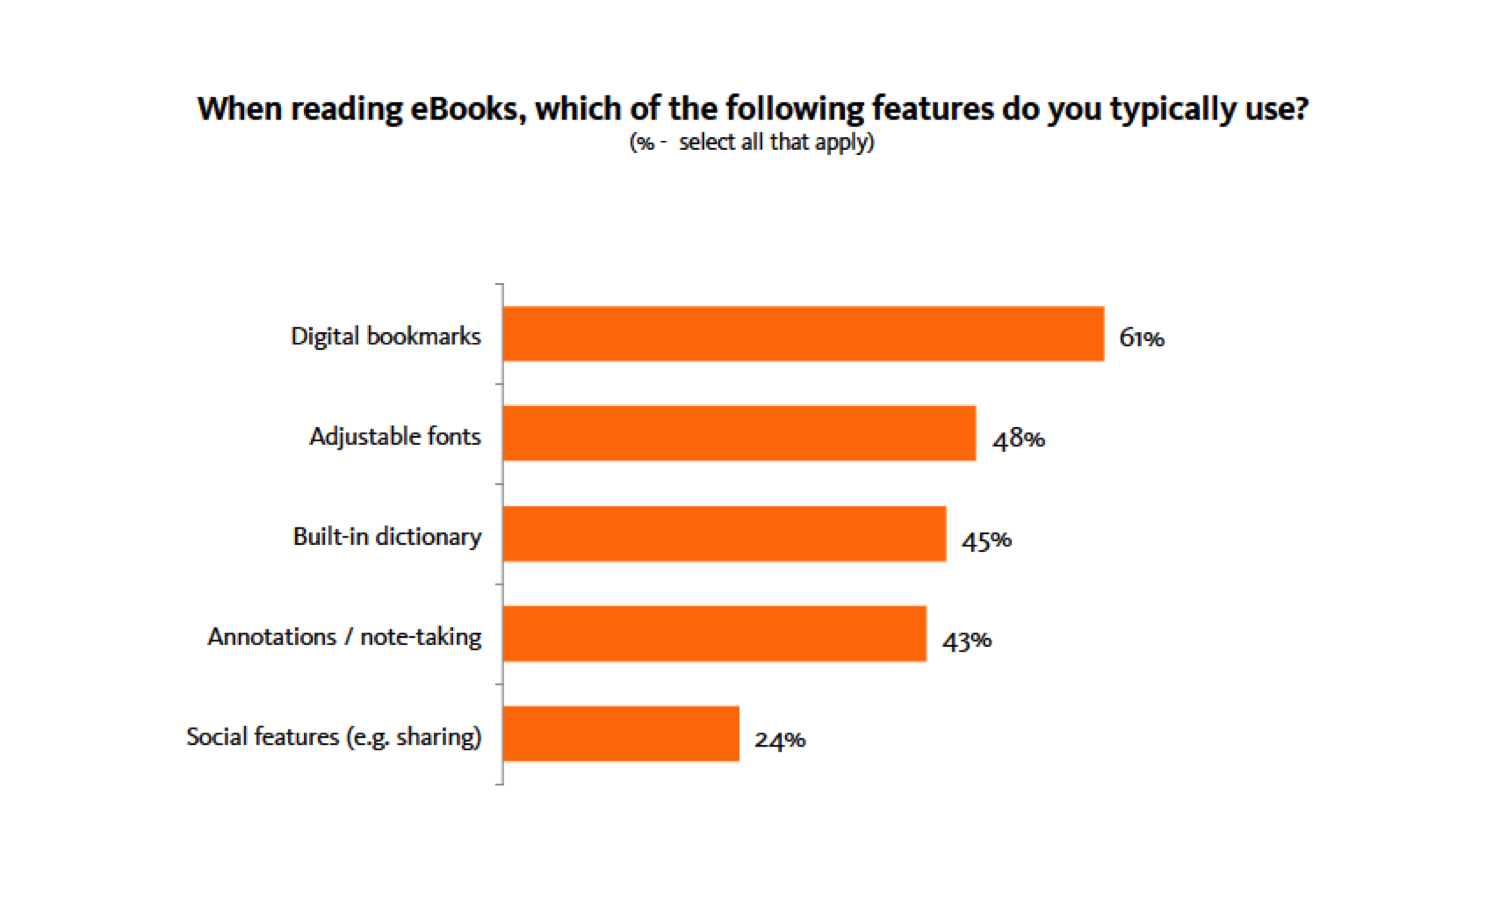
- When reading, eReaders are most often using basic features like digital bookmarks and adjustable fonts; use of social eReading features is less common
A hard copy of the report can be downloaded here.
Findings: Library Users vs. Non-Users
eLibrary users read more genres than non-users..

eLibrary users read more genres than non-users; a significantly greater proportion of library users read fiction, biography, classics, fantasy, and historical fiction, among others. Non-users reported reading Fiction and Action/Mystery the most and no children’s books.
Findings: eReading
eReaders read to keep up with current events, for work, and for research more than non-eReaders

eReaders read to keep up with current events, for work, and for research more than non-eReaders; they also read more non-book media in electronic formats. Current events are not a staple of content easily accessed via the library.
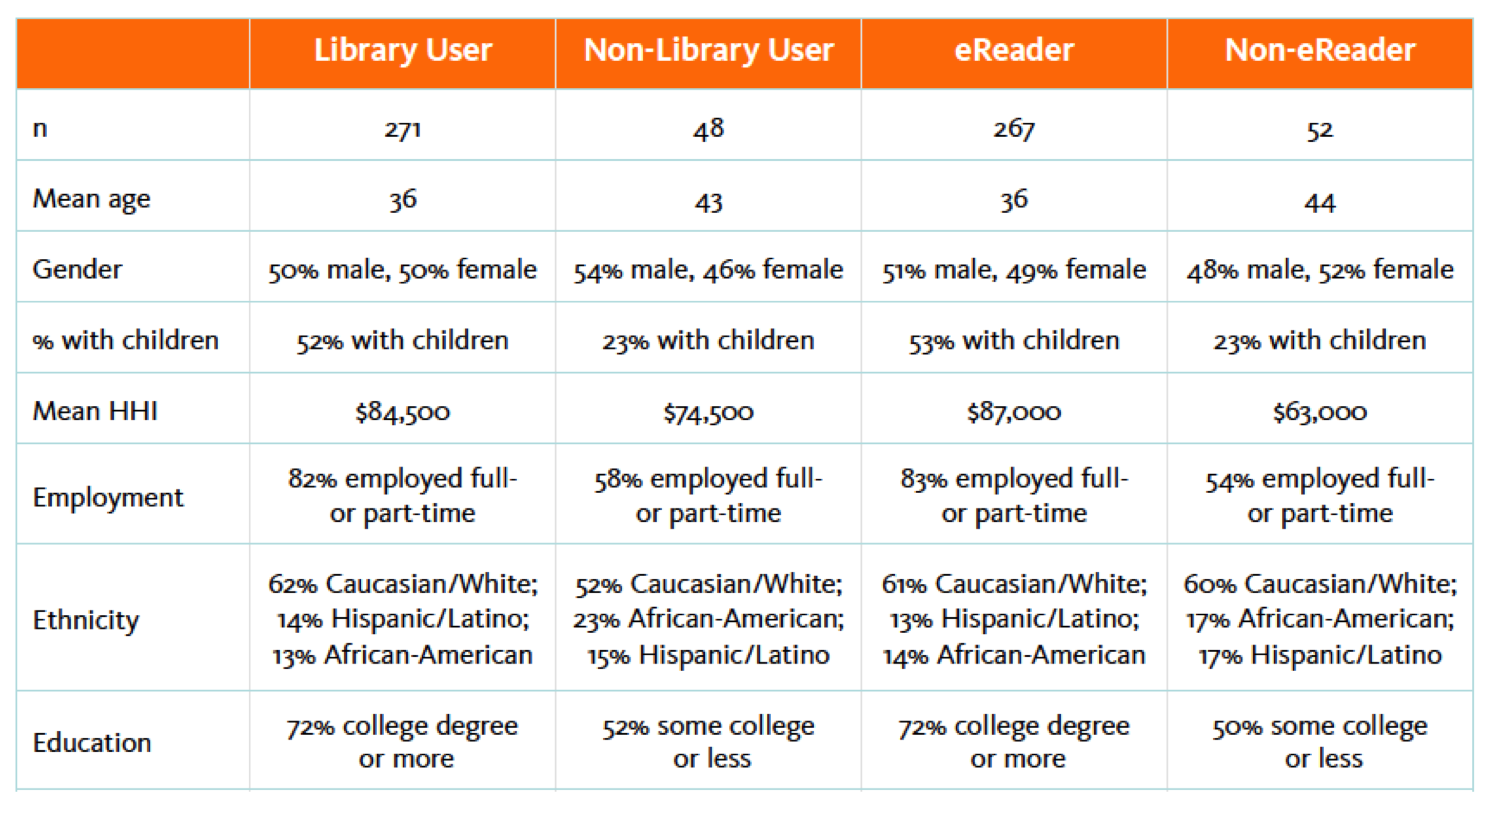
Findings: Demographics Tables
Demographics reflect only this research instrument and are not representative of the total population

Demographics reflect only this research instrument and are not representative of the total population, particularly since very few low-income individuals were reached.


