![[Stable]](figures/lifecycle-stable.svg)
Find possible outliers in the dataset.
Usage
find_outliers(
  .data = NULL,
  var = NULL,
  by = NULL,
  plots = FALSE,
  coef = 1.5,
  verbose = TRUE,
  plot_theme = theme_metan()
)
Arguments
- .data
The data to be analyzed. Must be a dataframe or an object of class
split_factors.- var
The variable to be analyzed.
- by
One variable (factor) to compute the function by. It is a shortcut to
dplyr::group_by(). To compute the statistics by more than one grouping variable use that function.- plots
If
TRUE, then histograms and boxplots are shown.- coef
The multiplication coefficient, defaults to 1.5. For more details see
?boxplot.stat.- verbose
If
verbose = TRUEthen some results are shown in the console.- plot_theme
The graphical theme of the plot. Default is
plot_theme = theme_metan(). For more details, seeggplot2::theme().
Author
Tiago Olivoto tiagoolivoto@gmail.com
Examples
# \donttest{
library(metan)
find_outliers(data_ge2, var = PH, plots = TRUE)
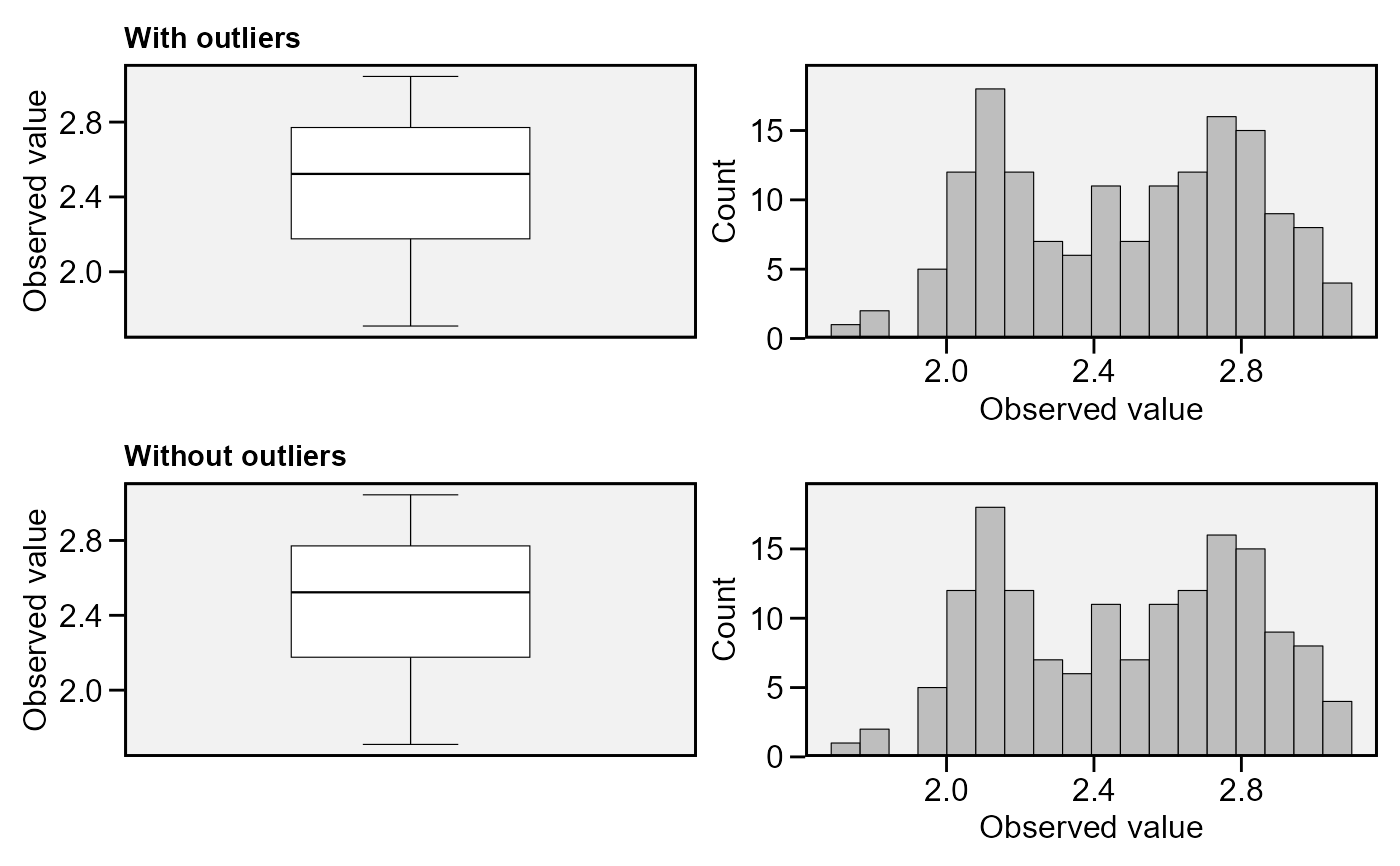 #> No possible outlier identified.
#>
# Find outliers within each environment
find_outliers(data_ge2, var = PH, by = ENV)
#> No possible outlier identified.
#>
#> No possible outlier identified.
#>
#> Trait: PH
#> Number of possible outliers: 4
#> Line(s): 7 11 14 15
#> Proportion: 11.4%
#> Mean of the outliers: 2.438
#> Maximum of the outliers: 2.766 | Line 11
#> Minimum of the outliers: 1.71 | Line 7
#> With outliers: mean = 2.167 | CV = 10.309%
#> Without outliers: mean = 2.136 | CV = 7.377%
#>
#> No possible outlier identified.
#>
#> ENV outliers
#> 1 A1 0
#> 2 A2 0
#> 3 A3 4
#> 4 A4 0
# }
#> No possible outlier identified.
#>
# Find outliers within each environment
find_outliers(data_ge2, var = PH, by = ENV)
#> No possible outlier identified.
#>
#> No possible outlier identified.
#>
#> Trait: PH
#> Number of possible outliers: 4
#> Line(s): 7 11 14 15
#> Proportion: 11.4%
#> Mean of the outliers: 2.438
#> Maximum of the outliers: 2.766 | Line 11
#> Minimum of the outliers: 1.71 | Line 7
#> With outliers: mean = 2.167 | CV = 10.309%
#> Without outliers: mean = 2.136 | CV = 7.377%
#>
#> No possible outlier identified.
#>
#> ENV outliers
#> 1 A1 0
#> 2 A2 0
#> 3 A3 4
#> 4 A4 0
# }