How To - Use the Debugger in Netbeans IDE
The NetBeans Debugger lets you place breakpoints in your source code, add field watches, step through your code, run into methods, take snapshots and monitor execution as it occurs. You can also attach the debugger to an already running process.
The Importance of the Debugger
Using the Debugger is absolutely critical to program development. It is one of the most important and useful tools to aid the development of your application. With the use of the Debugger you can look at the state of your application without needing to write custom software to inspect your own code. The Debugger lets you take a look at the values of your variables, memory usage and view almost every aspect of how your application is running and more specificaly how your code is being executed.
Walkthrough of Debugger:
Setting Breakpoints
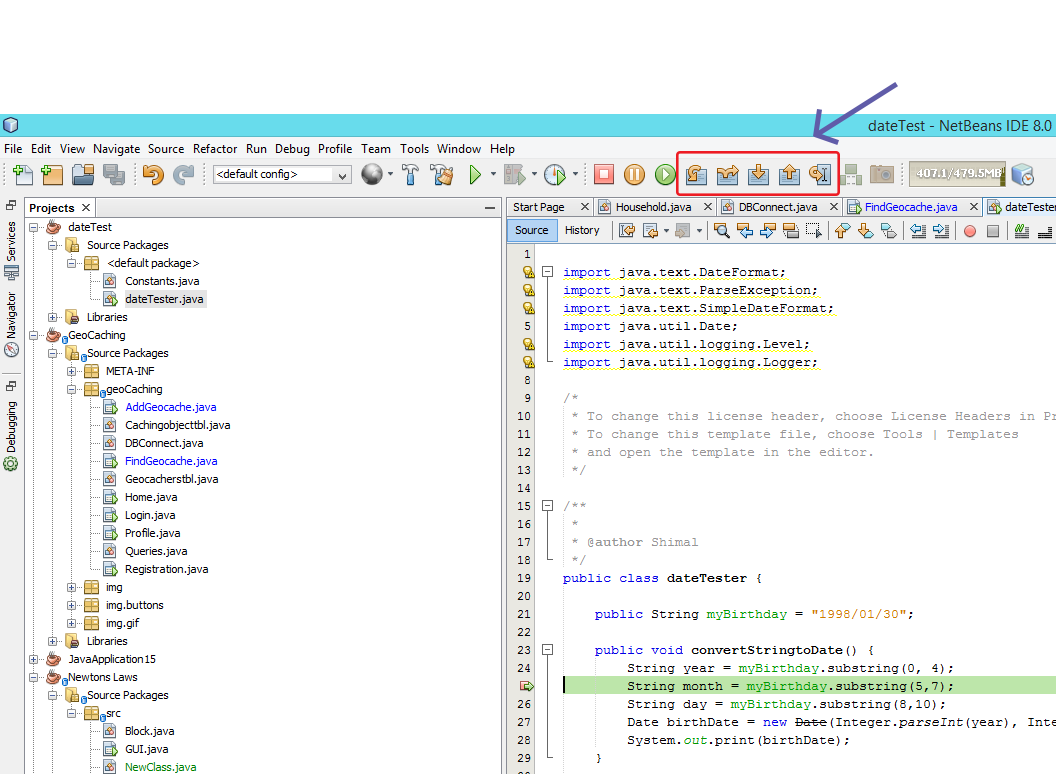
A breakpoint is a marker that you can set to specify where execution should pause when you are running your application in the IDE's debugger. Breakpoints are stored in the IDE (not in your application's code) and persist between debugging sessions and IDE sessions. When execution pauses on a breakpoint, the line where execution has paused is highlighted in green in the Source Editor and a message is printed in the Debugger Console with information on the breakpoint that has been reached. In their simplest form, breakpoints provide a way for you to pause the running program at a specific point so that you can:
- Monitor the values of variables at that point in the program's execution.
- Take control of program execution by stepping through code line by line or method by method. However, you can also use breakpoints as a diagnostic tool to do things such as:
- Detect when the value of a field or local variable is changed (which, for example, could help you determine what part of code assigned an inappropriate value to a field).
- Detect when an object is created (which might, for example, be useful when trying to track down a memory leak).
You can set multiple breakpoints and you can set different types of breakpoints. The simplest kind of breakpoint is a line breakpoint, where execution of the program stops at a specific line. You can also set breakpoints on other situations, such as the calling of a method, the throwing of an exception, or the changing of a variable's value. In addition, you can set conditions in some types of breakpoints so that they suspend execution of the program only under specific circumstances. See Table 5-5 for a summary of the types of breakpoints.
IREMEMBER: You don't have to attach a brackpoint to the line of code that is being executed initially. i.e, If you want to see what happens when a user clicks a Button, you don't have to attach the breakpoint to the code that executes the button itself, you can also attach the breakpoints to code/methods that are being executed as a result of the button being clicked.
You can attach a brakpoint to any line of code/method that is being executed at any point in your application. As soon as your code is executed your breakpoint will kick into effect.
| Breakpoint Type | Description |
|---|---|
| Line | Set on a line of code. When the debugger reaches that line, it stops before executing the line. The breakpoint is marked by pink background highlighting and the "breakpoint" icon. You can also specify conditions for line breakpoints |
| Class | Execution is suspended when the class is referenced from another class and before any lines of the class with the breakpoint are executed |
| Exception | Execution is suspended when an exception occurs. You can specify whether execution stops on caught exceptions, uncaught exceptions, or both. |
| Method | Execution is suspended when the method is called. |
| Variable | Execution is suspended when the variable is accessed. You can also configure the breakpoint to have execution suspended only when the variable is modified. |
| Thread | Execution is suspended whenever a thread is started or terminated. You can also set the breakpoint on the thread's death (or both the start and death of the thread). |
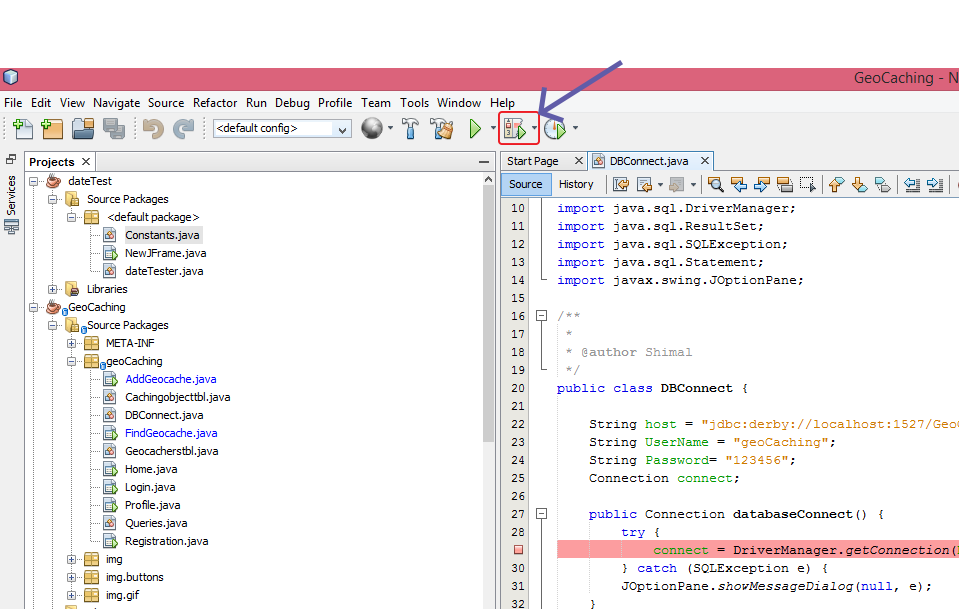
Starting a Debugging Session
To start a debugging session, first ensure that all your breakpoints have been set. Once you've set your breakpoints, click on the "Debugger" button to start the debugger.
Debugger Windows
When you start debugging a program, the Debugger Console appears as a tab in the lower
left corner of the IDE (as shown in Figure 5-3). The Debugger Console logs the execution status
of the debugged program (such as whether the code is stopped at a breakpoint). In addition, a tab
opens in the Output to log any application output (as well the output from the Ant build script the
IDE uses when running the command).
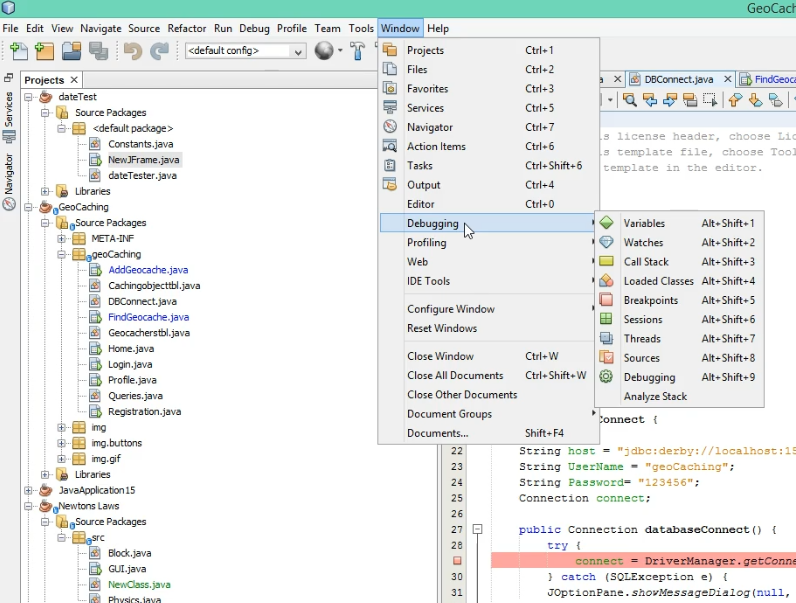
In the lower right hand corner, several windows (Watches, Local Variables, and Call Stack)
open as tabs and provide current information on the debugging session, such as the current values
of variables and a list of current method calls. You can also open individual debugging windows
by choosing from the Windows | Debugging menu.
| Debugger Window | Open With | Description |
|---|---|---|
| Local Variables | Alt-Shift-1 (or Window | Debugging | Local Variables) | Displays all fields and local variables in the debugger's current context and their current values. Fields are listed under the this node |
| Watches | Alt-Shift-2 (or Window | Debugging | Watches) | Displays the names of fields, local variables, or expressions that you have placed a watch on. Though all of your watches are displayed no matter the current context, the value displayed is the value for that context (not for the context that the watch was set in). For example, if you have a watch on the this keyword, the this referred to in the Watches window will always correspond to the object referred to from the current method call |
| Call Stack | Alt-Shift-3 (or Window | Debugging | Call Stack) | Displays all method calls in the current chain of calls. The Call Stack window enables you to jump directly to code of a method call, back up the program's execution to a previous method call, or select a context for viewing local variable values. |
| Classes | Alt-Shift-4 (or Window | Debugging | Classes) | Provides a tree view of classes for the currently debugged application grouped by classloader. |
| Breakpoints | Alt-Shift-5 (or Window | Debugging | Breakpoints) | Displays all breakpoints that you have set in all running debugging sessions. |
| Threads | Alt-Shift-6 (or Window | Debugging | Threads) | Displays the threads in the current session. In this window, you can switch the context by designated another thread is the current thread. |
| Sessions | Alt-Shift-7 (or Window | Debugging | Sessions) | Displays a node for each debugging session in the IDE. From this window, you can switch the current session |
| Sources | Alt-Shift-8 (or Window | Debugging | Sources) | Displays sources that are available for debugging and enables you to specify which ones to use. For example, you can use this window to enable debugging with JDK sources |
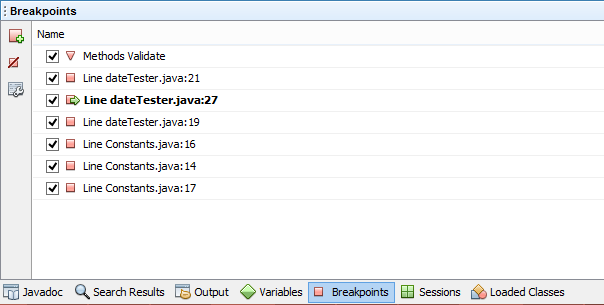
Managing Breakpoints
You can use the Breakpoints window as shown in Figure 5-5 to manage breakpoints in one
place. You can put breakpoints in groups, temporarily disable breakpoints, and provide
customizations to the breakpoints from this window. To open the Breakpoints window, choose
Window | Debugging | Breakpoints or press Alt-Shift-5.
Stepping Through Code
Once execution of your program is paused, you have several ways of resuming execution of
the code. You can step through code line by line (Step In) or in greater increments. See Table 5-4
for the commands available for stepping or continuing execution or the following sub-topics for a
task-based look at the commands.
| Step Command | Description |
|---|---|
| Step Into (F7) | Executes the current line. If the line is a call to a method or constructor and there is source available for the called code, the program counter moves to the declaration of the method or constructor. Otherwise, the program counter moves to the next line in the file. |
| Step Over (F8) | Executes the current line and moves the program counter to the next line in the file. If the executed line is a call to a method or constructor, the code in the method or constructor is also executed. |
| Step Out of (Alt-ShiftF7) | Executes the rest of the code in the current method or constructor and moves the program counter to the line after the caller of the method or constructor. This command is useful if you have stepped into a method that you do not need to analyze. |
| Run to Cursor (F4) | Executes all of the lines in the program between the current line and the insertion point in the Source Editor |
| Pause | Stop all threads in the current session. |
| Continue (Ctrl-F5) | Resume execution of the program until the next breakpoint. |
Monitoring Variables & Expressions
As you step through a program, you can monitor the running values of fields and local variables in the following ways:
- By holding the cursor over an identifier in the Source Editor to display a tooltip containing the value of the identifier in the current debugging context.
- By monitoring the values of variables and fields displayed in the Local Variables window
- By setting a watch for an identifier or other expression and monitoring its value in the Watches window.
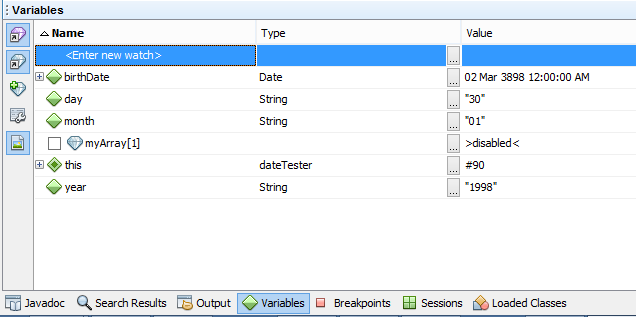
The Local Variables window (as shown in Figure 5-6) displays all variables that are
currently in relevant in the current execution context of the program and provides and lists their
types and values. If the value of the variable is an object reference, the value is given with the
pound sign (#) and a number which serves as an identifier of the object's instance. You can jump
to the source code for a variable by double-clicking the variable name.