Warning
Piecharts are highly criticized in dataviz. Use it with care, or even better, use alternatives like barcharts, lollipop plots, treemap and others.
What's wrong with it? Barchart LollipopStep by step → the
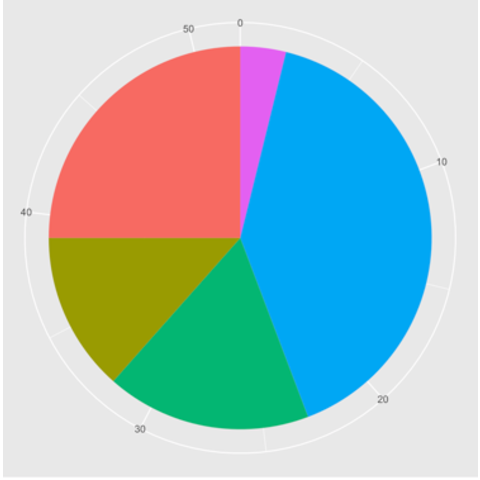
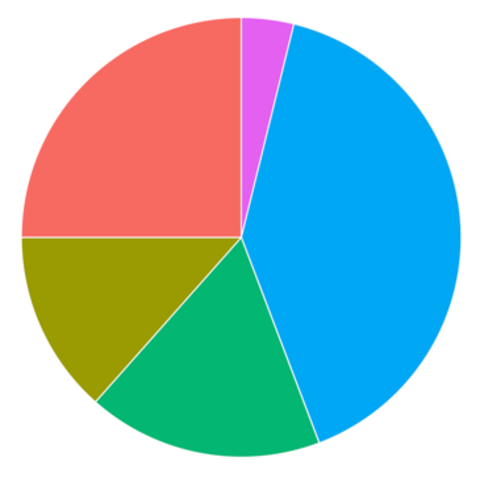
pie() functionThe pie() function is natively provided in R. It allows to build nice piechart in seconds. Here is an overview of its functioning:
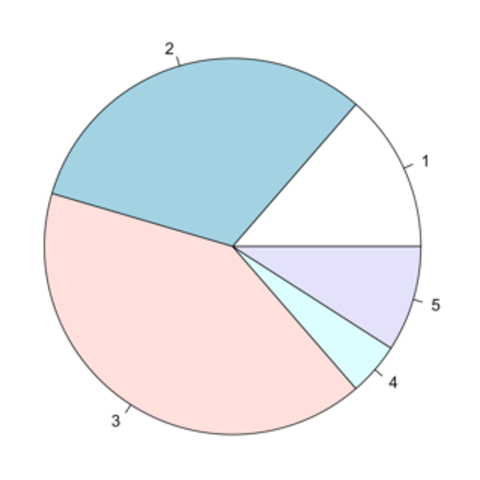
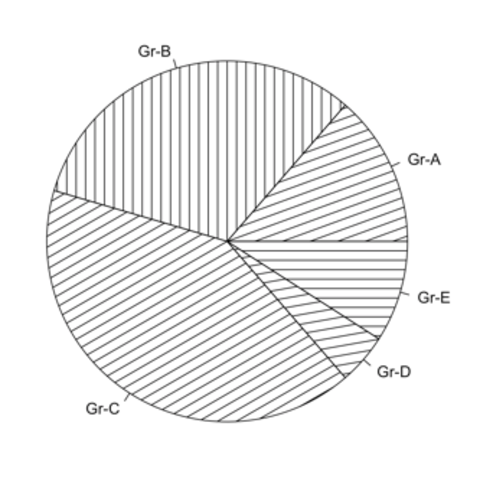
Step by step → the
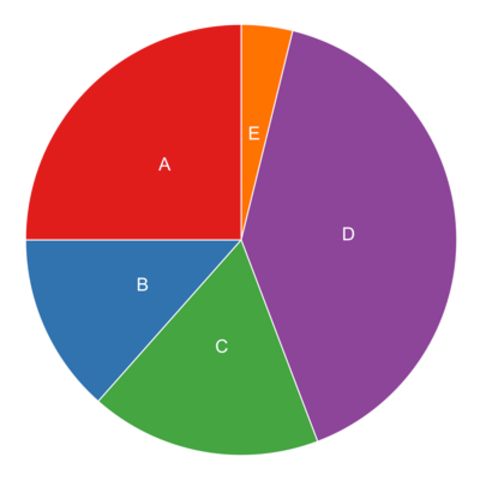
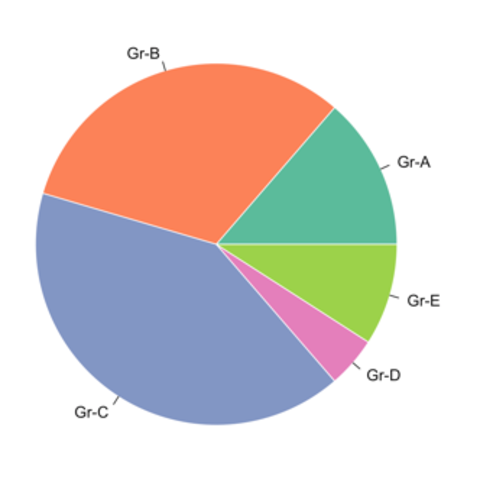
ggplot2 packageThere is no specific geom to build piechart with ggplot2. The trick is to build a barplot and use coord_polar to make it circular. This is why the pie() function described above is probably a better alternative.