Convert foreign object to an sf object
st_as_sf(x, ...)

# S3 method for data.frame
st_as_sf(
  x,
  ...,
  agr = NA_agr_,
  coords,
  wkt,
  dim = "XYZ",
  remove = TRUE,
  na.fail = TRUE,
  sf_column_name = NULL
)

# S3 method for sf
st_as_sf(x, ...)

# S3 method for sfc
st_as_sf(x, ...)

# S3 method for Spatial
st_as_sf(x, ...)

# S3 method for map
st_as_sf(x, ..., fill = TRUE, group = TRUE)

# S3 method for ppp
st_as_sf(x, ...)

# S3 method for psp
st_as_sf(x, ...)

# S3 method for lpp
st_as_sf(x, ...)
Arguments
| x | object to be converted into an object class |
|---|---|
| ... | passed on to st_sf, might included named arguments |
| agr | character vector; see details section of st_sf |
| coords | in case of point data: names or numbers of the numeric columns holding coordinates |
| wkt | name or number of the character column that holds WKT encoded geometries |
| dim | passed on to st_point (only when argument coords is given) |
| remove | logical; when coords or wkt is given, remove these columns from data.frame? |
| na.fail | logical; if |
| sf_column_name | character; name of the active list-column with simple feature geometries; in case
there is more than one and |
| fill | logical; the value for |
| group | logical; if |
Details
setting argument wkt annihilates the use of argument coords. If x contains a column called "geometry", coords will result in overwriting of this column by the sfc geometry list-column. Setting wkt will replace this column with the geometry list-column, unless remove_coordinates is FALSE.
Examples
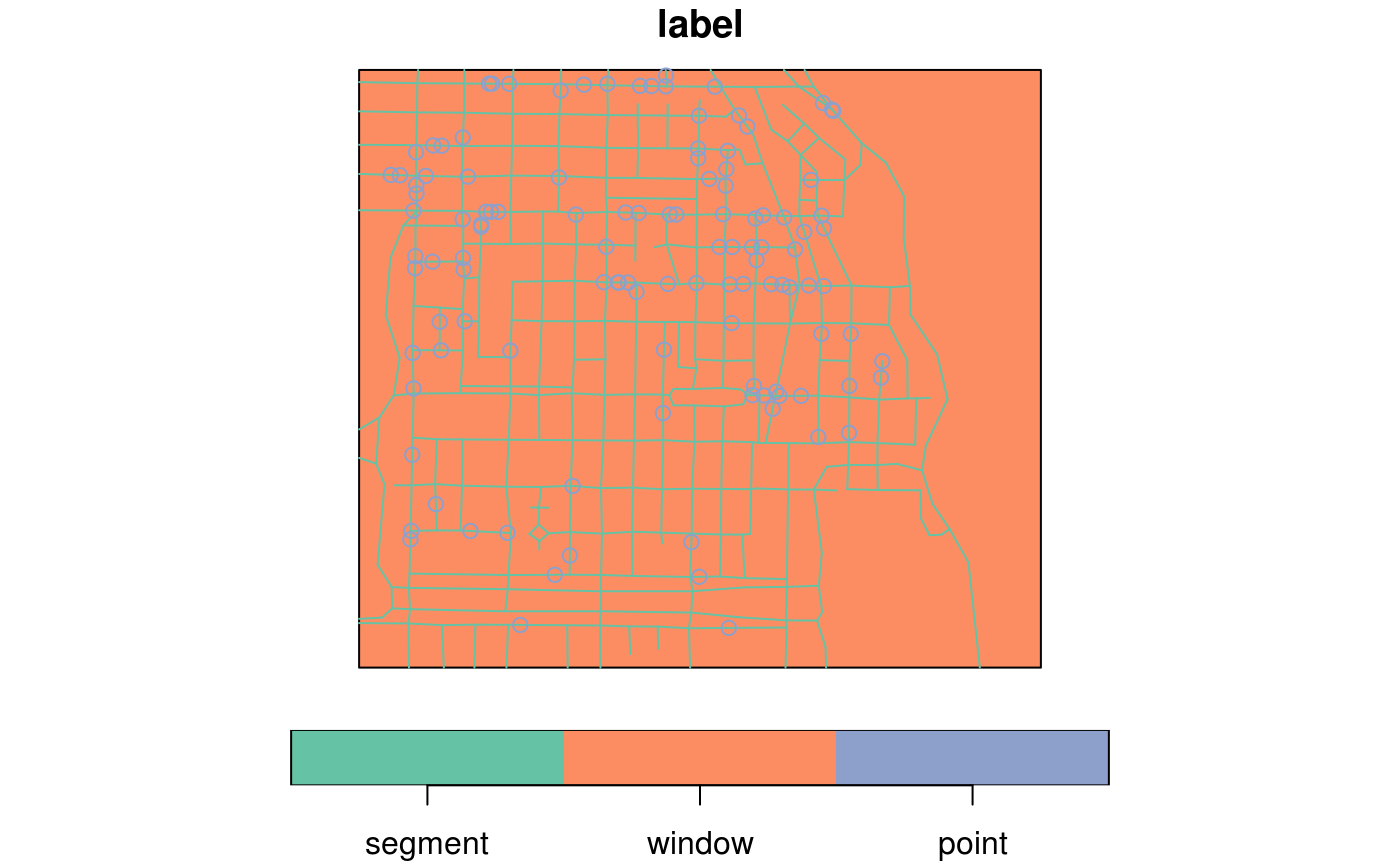
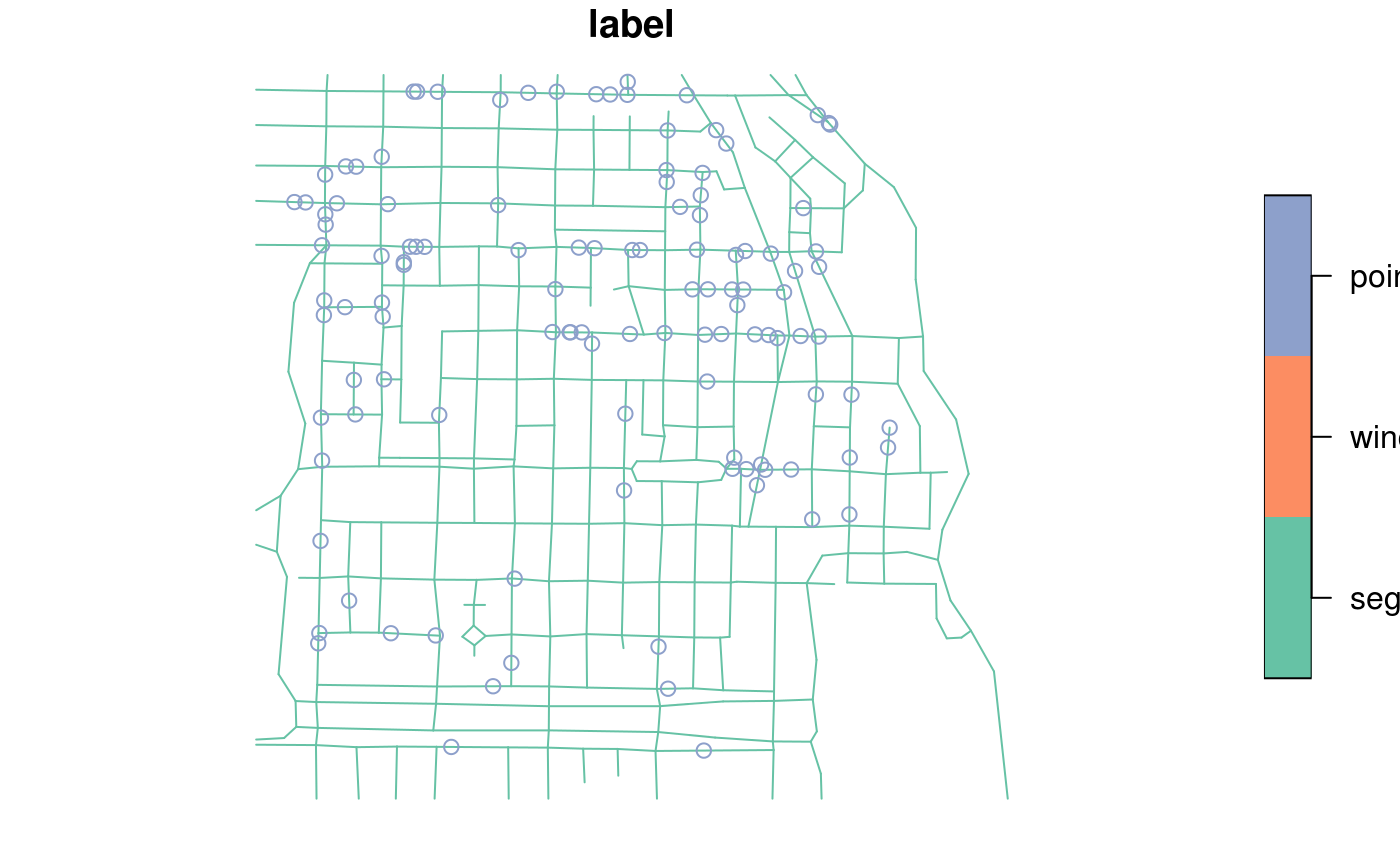
#> Geometry set for 2 features #> geometry type: POINT #> dimension: XY #> bbox: xmin: 0 ymin: 1 xmax: 1 ymax: 1 #> CRS: NA#>#>d = data.frame(a = 1:2) d$geom = st_sfc(pt1, pt2) df = st_as_sf(d) d$geom = c("POINT(0 0)", "POINT(0 1)") df = st_as_sf(d, wkt = "geom") d$geom2 = st_sfc(pt1, pt2) st_as_sf(d) # should warn#> Simple feature collection with 2 features and 2 fields #> geometry type: POINT #> dimension: XY #> bbox: xmin: 0 ymin: 1 xmax: 1 ymax: 1 #> CRS: NA #> a geom geom2 #> 1 1 POINT(0 0) POINT (0 1) #> 2 2 POINT(0 1) POINT (1 1)data(meuse, package = "sp") meuse_sf = st_as_sf(meuse, coords = c("x", "y"), crs = 28992, agr = "constant") meuse_sf[1:3,]#> Simple feature collection with 3 features and 12 fields #> Attribute-geometry relationship: 12 constant, 0 aggregate, 0 identity #> geometry type: POINT #> dimension: XY #> bbox: xmin: 181025 ymin: 333537 xmax: 181165 ymax: 333611 #> CRS: EPSG:28992 #> cadmium copper lead zinc elev dist om ffreq soil lime landuse dist.m #> 1 11.7 85 299 1022 7.909 0.00135803 13.6 1 1 1 Ah 50 #> 2 8.6 81 277 1141 6.983 0.01222430 14.0 1 1 1 Ah 30 #> 3 6.5 68 199 640 7.800 0.10302900 13.0 1 1 1 Ah 150 #> geometry #> 1 POINT (181072 333611) #> 2 POINT (181025 333558) #> 3 POINT (181165 333537)summary(meuse_sf)#> cadmium copper lead zinc #> Min. : 0.200 Min. : 14.00 Min. : 37.0 Min. : 113.0 #> 1st Qu.: 0.800 1st Qu.: 23.00 1st Qu.: 72.5 1st Qu.: 198.0 #> Median : 2.100 Median : 31.00 Median :123.0 Median : 326.0 #> Mean : 3.246 Mean : 40.32 Mean :153.4 Mean : 469.7 #> 3rd Qu.: 3.850 3rd Qu.: 49.50 3rd Qu.:207.0 3rd Qu.: 674.5 #> Max. :18.100 Max. :128.00 Max. :654.0 Max. :1839.0 #> #> elev dist om ffreq soil lime #> Min. : 5.180 Min. :0.00000 Min. : 1.000 1:84 1:97 0:111 #> 1st Qu.: 7.546 1st Qu.:0.07569 1st Qu.: 5.300 2:48 2:46 1: 44 #> Median : 8.180 Median :0.21184 Median : 6.900 3:23 3:12 #> Mean : 8.165 Mean :0.24002 Mean : 7.478 #> 3rd Qu.: 8.955 3rd Qu.:0.36407 3rd Qu.: 9.000 #> Max. :10.520 Max. :0.88039 Max. :17.000 #> NA's :2 #> landuse dist.m geometry #> W :50 Min. : 10.0 POINT :155 #> Ah :39 1st Qu.: 80.0 epsg:28992 : 0 #> Am :22 Median : 270.0 +proj=ster...: 0 #> Fw :10 Mean : 290.3 #> Ab : 8 3rd Qu.: 450.0 #> (Other):25 Max. :1000.0 #> NA's : 1library(sp) x = rbind(c(-1,-1), c(1,-1), c(1,1), c(-1,1), c(-1,-1)) x1 = 0.1 * x + 0.1 x2 = 0.1 * x + 0.4 x3 = 0.1 * x + 0.7 y = x + 3 y1 = x1 + 3 y3 = x3 + 3 m = matrix(c(3, 0), 5, 2, byrow = TRUE) z = x + m z1 = x1 + m z2 = x2 + m z3 = x3 + m p1 = Polygons(list( Polygon(x[5:1,]), Polygon(x2), Polygon(x3), Polygon(y[5:1,]), Polygon(y1), Polygon(x1), Polygon(y3)), "ID1") p2 = Polygons(list( Polygon(z[5:1,]), Polygon(z2), Polygon(z3), Polygon(z1)), "ID2") if (require("rgeos")) { r = createSPComment(SpatialPolygons(list(p1,p2))) comment(r) comment(r@polygons[[1]]) scan(text = comment(r@polygons[[1]]), quiet = TRUE) library(sf) a = st_as_sf(r) summary(a) }#>#> #> #> #>#> geometry #> MULTIPOLYGON:2 #> epsg:NA :0#> cadmium copper lead zinc #> Min. : 0.200 Min. : 14.00 Min. : 37.0 Min. : 113.0 #> 1st Qu.: 0.800 1st Qu.: 23.00 1st Qu.: 72.5 1st Qu.: 198.0 #> Median : 2.100 Median : 31.00 Median :123.0 Median : 326.0 #> Mean : 3.246 Mean : 40.32 Mean :153.4 Mean : 469.7 #> 3rd Qu.: 3.850 3rd Qu.: 49.50 3rd Qu.:207.0 3rd Qu.: 674.5 #> Max. :18.100 Max. :128.00 Max. :654.0 Max. :1839.0 #> #> elev dist om ffreq soil lime #> Min. : 5.180 Min. :0.00000 Min. : 1.000 1:84 1:97 0:111 #> 1st Qu.: 7.546 1st Qu.:0.07569 1st Qu.: 5.300 2:48 2:46 1: 44 #> Median : 8.180 Median :0.21184 Median : 6.900 3:23 3:12 #> Mean : 8.165 Mean :0.24002 Mean : 7.478 #> 3rd Qu.: 8.955 3rd Qu.:0.36407 3rd Qu.: 9.000 #> Max. :10.520 Max. :0.88039 Max. :17.000 #> NA's :2 #> landuse dist.m geometry #> W :50 Min. : 10.0 POINT :155 #> Ah :39 1st Qu.: 80.0 epsg:NA : 0 #> Am :22 Median : 270.0 +proj=ster...: 0 #> Fw :10 Mean : 290.3 #> Ab : 8 3rd Qu.: 450.0 #> (Other):25 Max. :1000.0 #> NA's : 1#> part.a part.b dist soil ffreq #> Min. :0.0000 Min. :0.0000 Min. :0.0000 1:1665 1: 779 #> 1st Qu.:0.0000 1st Qu.:0.0000 1st Qu.:0.1193 2:1084 2:1335 #> Median :0.0000 Median :1.0000 Median :0.2715 3: 354 3: 989 #> Mean :0.3986 Mean :0.6014 Mean :0.2971 #> 3rd Qu.:1.0000 3rd Qu.:1.0000 3rd Qu.:0.4402 #> Max. :1.0000 Max. :1.0000 Max. :0.9926 #> geometry #> POINT :3103 #> epsg:NA : 0 #> +proj=ster...: 0 #> #> #>#> geometry #> POLYGON :1 #> epsg:NA :0 #> +proj=ster...:0#> geometry #> POLYGON :1 #> epsg:NA :0 #> +proj=ster...:0#> geometry #> LINESTRING :1 #> epsg:NA :0 #> +proj=ster...:0#> part.a part.b dist soil ffreq #> Min. :0.0000 Min. :0.0000 Min. :0.0000 1:1665 1: 779 #> 1st Qu.:0.0000 1st Qu.:0.0000 1st Qu.:0.1193 2:1084 2:1335 #> Median :0.0000 Median :1.0000 Median :0.2715 3: 354 3: 989 #> Mean :0.3986 Mean :0.6014 Mean :0.2971 #> 3rd Qu.:1.0000 3rd Qu.:1.0000 3rd Qu.:0.4402 #> Max. :1.0000 Max. :1.0000 Max. :0.9926 #> geometry #> POLYGON :3103 #> epsg:NA : 0 #> +proj=ster...: 0 #> #> #>#> part.a part.b dist soil ffreq #> Min. :0.0000 Min. :0.0000 Min. :0.0000 1:1665 1: 779 #> 1st Qu.:0.0000 1st Qu.:0.0000 1st Qu.:0.1193 2:1084 2:1335 #> Median :0.0000 Median :1.0000 Median :0.2715 3: 354 3: 989 #> Mean :0.3986 Mean :0.6014 Mean :0.2971 #> 3rd Qu.:1.0000 3rd Qu.:1.0000 3rd Qu.:0.4402 #> Max. :1.0000 Max. :1.0000 Max. :0.9926 #> geometry #> LINESTRING :3103 #> epsg:NA : 0 #> +proj=ster...: 0 #> #> #>#>#>#>#> #>#> #> #>#>#> #> #>#> #> #>#> #>#> Simple feature collection with 647 features and 4 fields #> geometry type: POINT #> dimension: XY #> bbox: xmin: 580797.3 ymin: 675238.7 xmax: 584945.3 ymax: 678313.5 #> CRS: NA #> First 10 features: #> label group season date geom #> 1 point major dry 2006-01-06 POINT (582518.4 676886.2) #> 2 point major dry 2006-01-10 POINT (581823 677422.7) #> 3 point major dry 2006-01-15 POINT (582131 676937.9) #> 4 point major dry 2006-01-24 POINT (582111.9 677420) #> 5 point minor dry 2006-01-27 POINT (582585.1 677509.7) #> 6 point major dry 2006-01-28 POINT (582302.3 677521.6) #> 7 point major dry 2006-02-01 POINT (583167.2 676730.5) #> 8 point major dry 2006-02-03 POINT (583584.5 677207.1) #> 9 point major dry 2006-02-13 POINT (583117.8 676850.3) #> 10 point major dry 2006-02-15 POINT (582902.8 676724.1)if (require(spatstat)) { data(chicago) plot(st_as_sf(chicago)["label"]) plot(st_as_sf(chicago)[-1,"label"]) }