Section 3 Token Analysis
This chapter contains the code for wrangling the cleaned and tokenized data into data-frames containing word frequencies and visualizing the data using the raw counts derived from this process.
knitr::opts_chunk$set(message = FALSE, warning = FALSE, echo = TRUE)
# set to TRUE to run this on only one reference file
debugging <- FALSE
# this will expect the file or files to be in a subdirectory with the following name
refsource <- "MungingProj2"
dataDir <- "Proj2Data"
workingDir <- refsource

# prefixes for all File reads and writes
# titles for tables
titletext <- "RedditCrypto"
srs = c("CryptoCurrency","CryptoMarkets")

`%notin%` <- Negate(`%in%`)
3.1 Import
3.2 Token Counts
3.2.1 Most Frequent Tokens
The following code show the top 25 most frequently occuring words within each subreddit.
| word | n |
|---|---|
| people | 18605 |
| crypto | 17983 |
| bitcoin | 13204 |
| money | 12433 |
| time | 9221 |
| btc | 9095 |
| market | 8906 |
| buy | 7798 |
| coins | 6151 |
| coin | 5784 |
| price | 5536 |
| lot | 4204 |
| lol | 4189 |
| sell | 3983 |
| exchange | 3971 |
| currency | 3949 |
| shit | 3833 |
| day | 3802 |
| blockchain | 3537 |
| eth | 3412 |
| pay | 3364 |
| fees | 3296 |
| world | 3259 |
| yeah | 3240 |
| real | 3209 |
3.3 Wordclouds
Wordcloud is constructed using the top 100 words.
#sr_allCount <- allCount %>% filter(!subreddit == "r/all [control]")
sr_allWC <- allCount %>%
  top_n(100) %>%
mutate(prop = n / max(n))set.seed(29)
ggplot(sr_allWC, aes(label = word, size = prop, color = prop)) +
geom_text_wordcloud_area(shape = 'circle', rm_outside = TRUE) +
scale_size_area(max_size = 30) +
theme_minimal()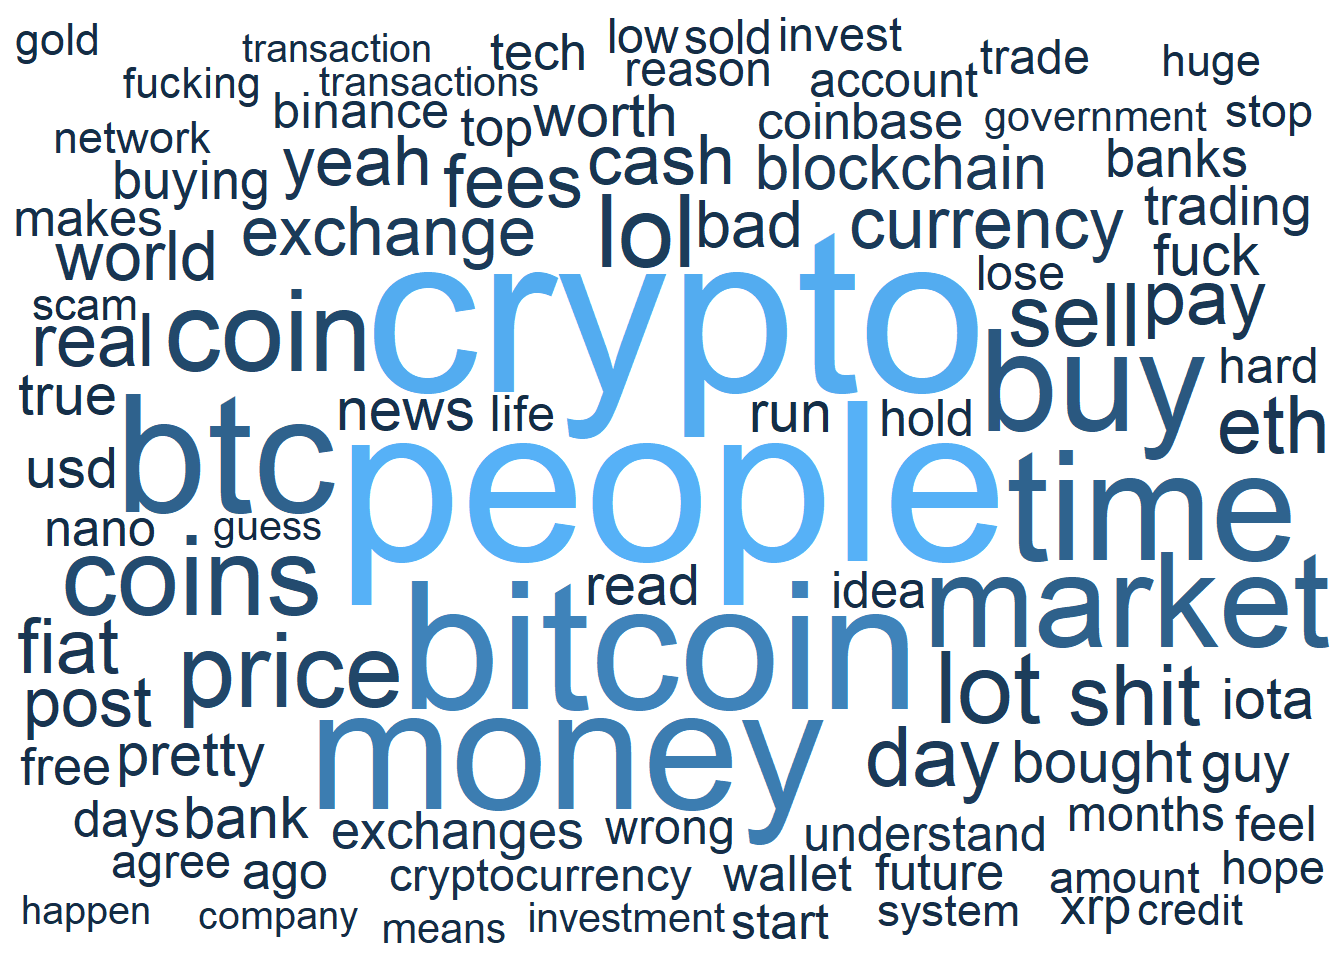
3.3.1 Wordclouds over time
TknsByDate <- TknsC %>%
  separate(created, c("created", "time"), " ") %>%
  mutate(created = ymd(created)) %>%
  mutate_at(vars(created), funs(year, month, day))
TknsByMonth <-TknsByDate %>%
filter(year > 2015) %>%
mutate(Month = make_date(year, month))
monthCount <- TknsByMonth %>%
group_by(subreddit, month, year) %>% #group words by affiliation label
count(word, sort = TRUE) %>% #count and create column 'n'
top_n(10, n) %>%
ungroup()
monthCount <- monthCount %>%
group_by(subreddit, month, year) %>%
mutate(prop = n / max(n))
table(monthCount$subreddit)##
## r/CryptoCurrency r/CryptoMarkets
## 396 435ggplot(monthCount, aes(
label = word,
size = prop,
color = prop
)) +
geom_text_wordcloud_area(rm_outside = TRUE) +
scale_size_area(max_size = 5) +
theme_minimal() +
facet_grid(vars(month), vars(year))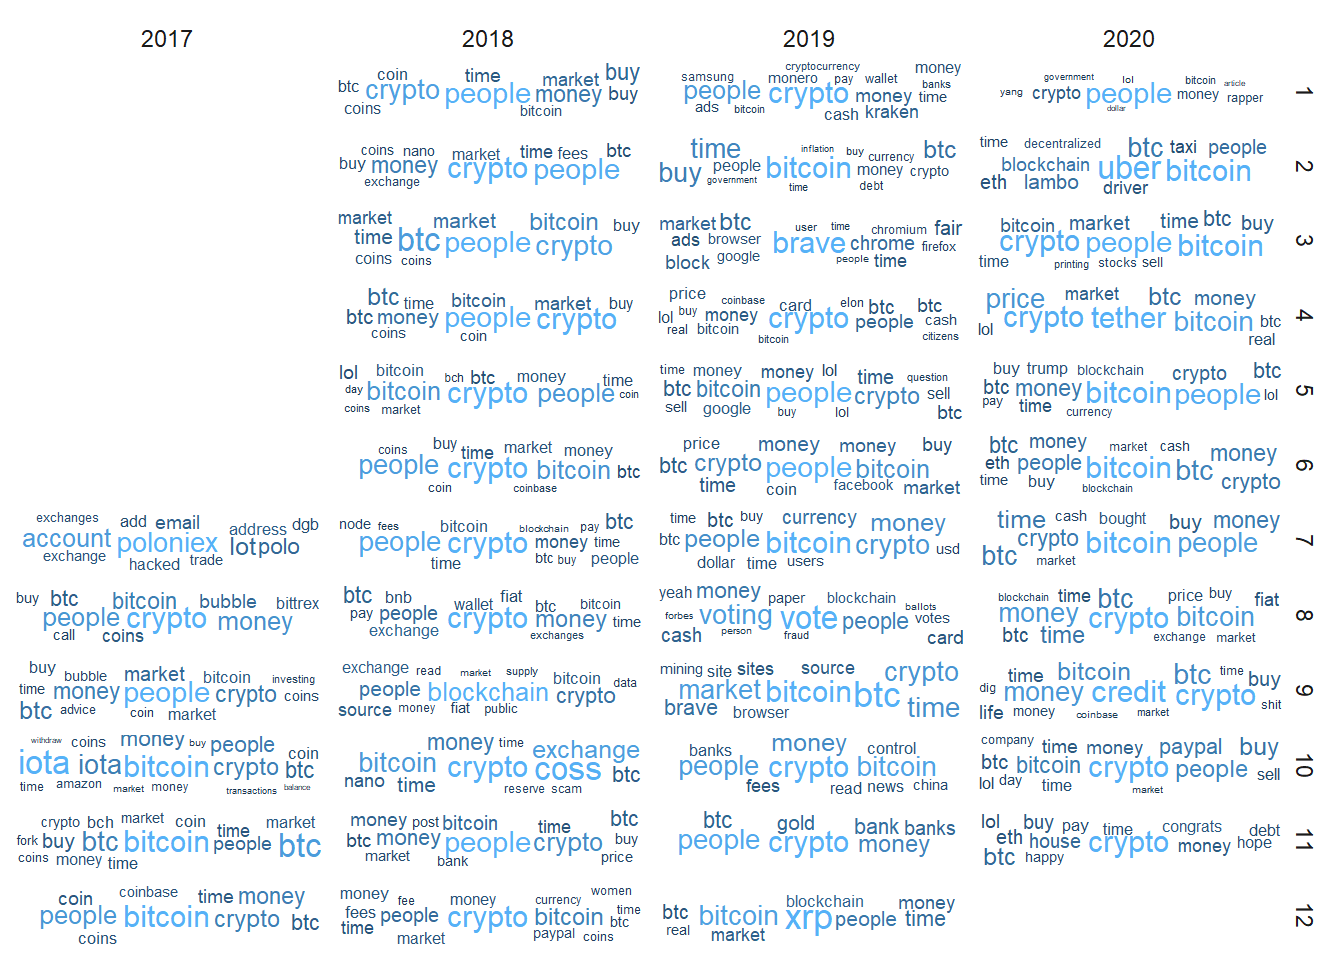
3.4 Currencies
BTC <- c("Bitcoin", "bitcoin", "BTC", "btc", "Btc")
ETH <- c("Ethereum", "ethereum", "ETH", "eth", "Eth")
XRP <- c("Ripple", "ripple", "XRP", "xrp", "Xrp")
LTC <- c("Litecoin", "litecoin", "LTC", "ltc", "Ltc")

currencies <- c(BTC, ETH, XRP, LTC)

# For frequency analysis
CurTkns <- TknsByDate %>%
  filter(word %in% currencies)

# For sentiment analysis
CurComms <- CommData %>%
  filter(comm_id %in% CurTkns$comm_id)
3.4.1 Assigning Identifiers
CurTkns <- CurTkns %>%
  mutate(Coin = case_when(
    .$word %in% BTC ~ "BTC",
    .$word %in% ETH ~ "ETH",
    .$word %in% XRP ~ "XRP",
    .$word %in% LTC ~ "LTC"
  ))
# Establish date column for grouping
curTknsByMonth <-CurTkns %>%
mutate(Month = make_date(year, month))
curCounts <- curTknsByMonth %>%
group_by(Coin) %>% #group words by affiliation label
count(word, sort = TRUE) %>% #count and create column 'n'
ungroup()
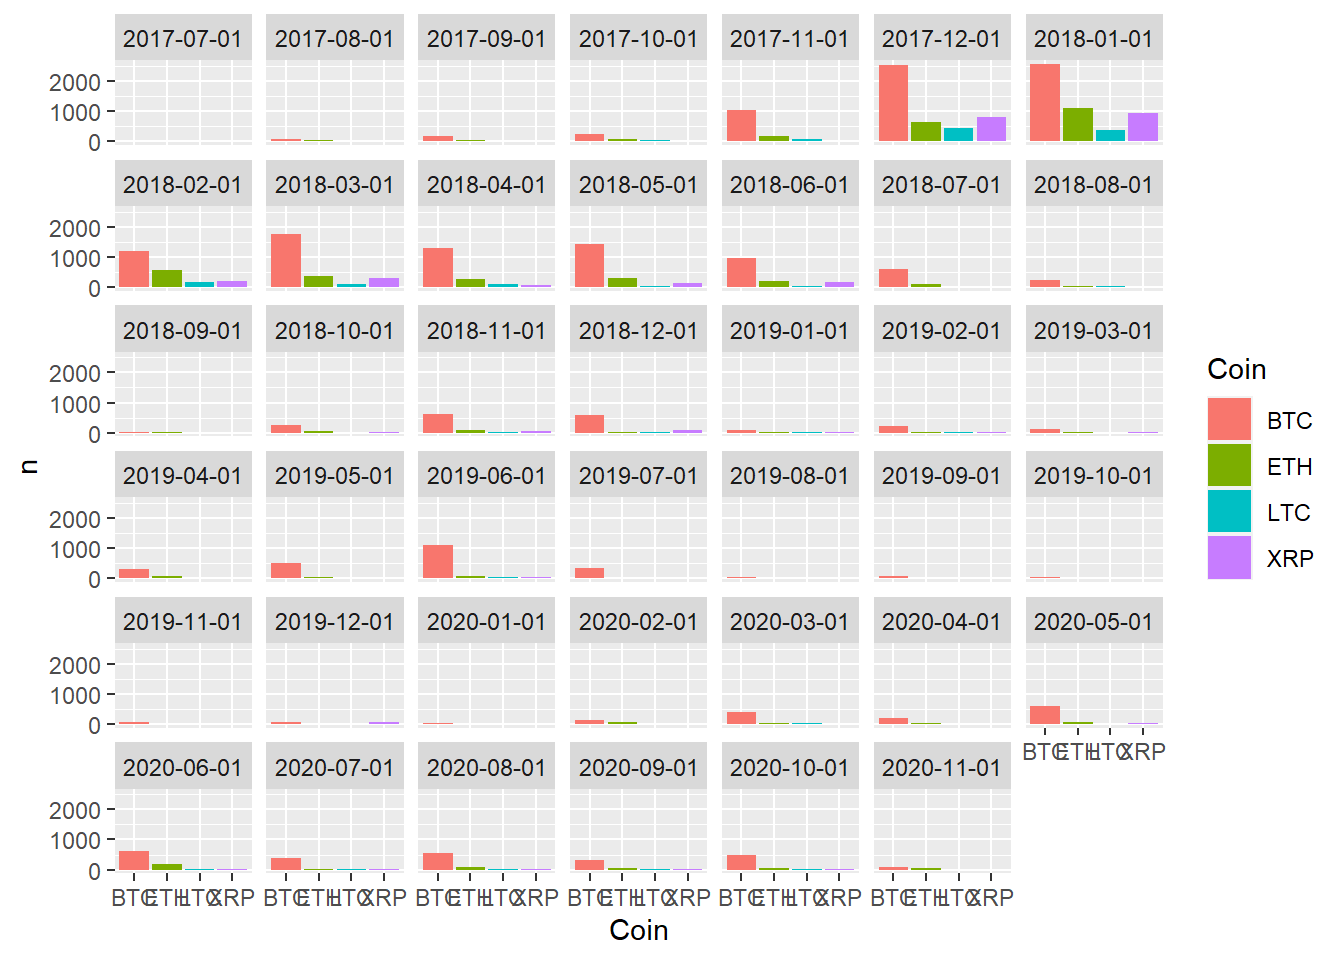
curCountsbyMonth <- curTknsByMonth %>%
group_by(Coin, Month) %>% #group words by affiliation label
count(word, sort = TRUE) %>% #count and create column 'n'
ungroup()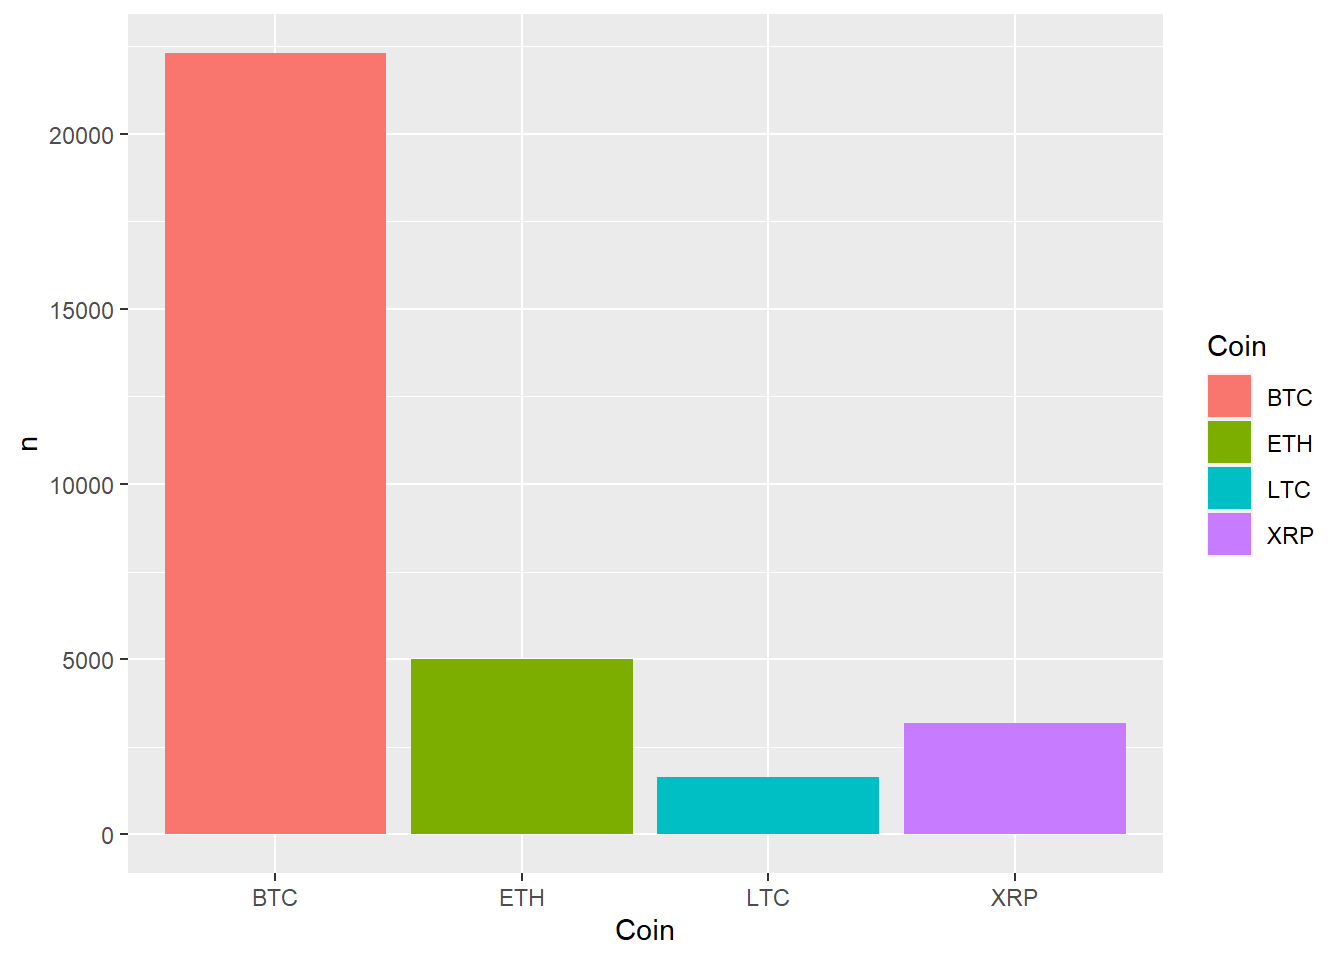
ggplot(curCountsbyMonth) +
  geom_bar(aes(x = Coin, y = n, fill = Coin), stat = "identity") +
  facet_wrap(~Month)