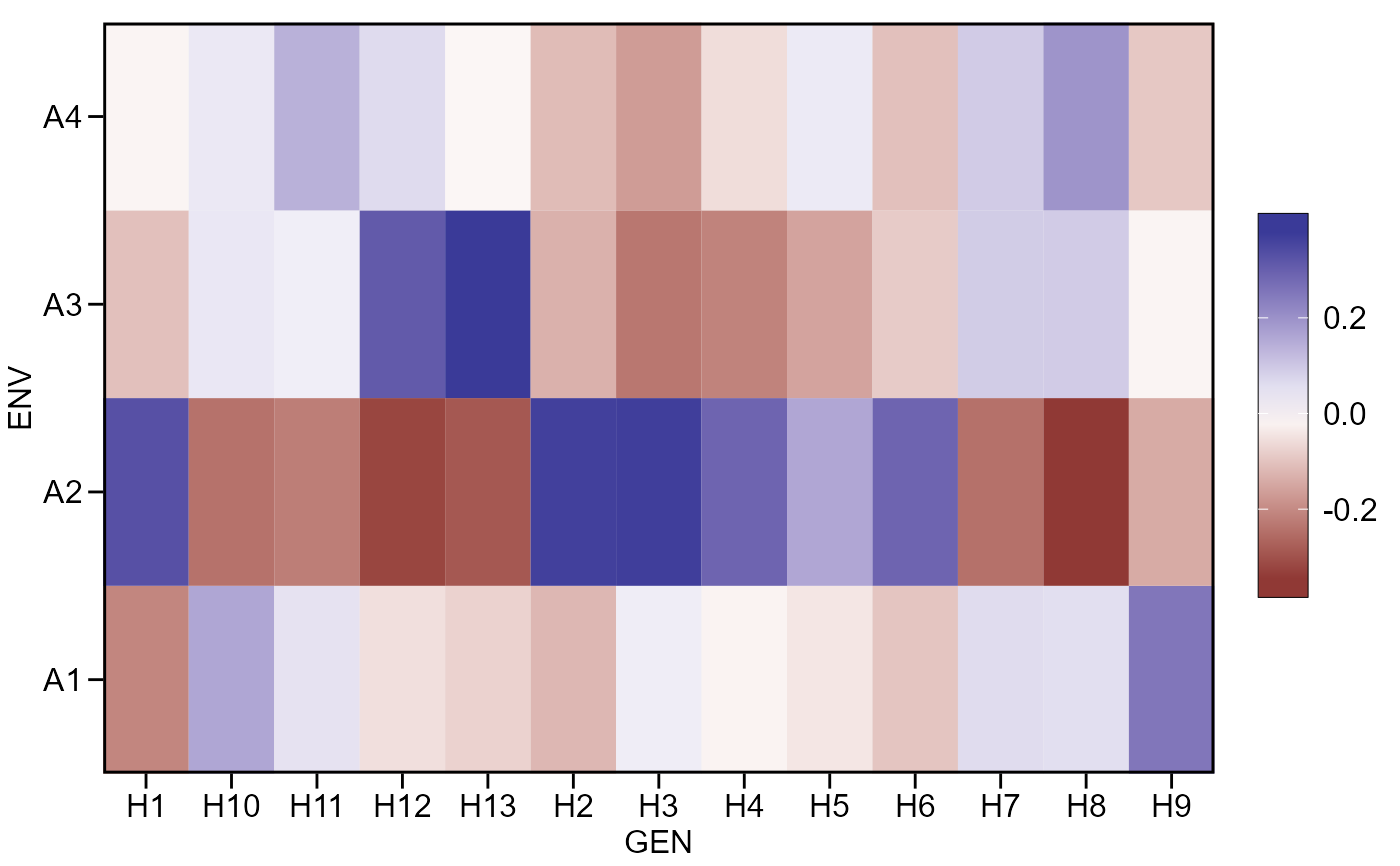
Plot the regression model generated by the function ge_effects.
Usage
# S3 method for ge_effects
plot(
  x,
  var = 1,
  plot_theme = theme_metan(),
  x.lab = NULL,
  y.lab = NULL,
  leg.position = "right",
  size.text = 12,
  ...
)
Arguments
- x
An object of class
ge_effects- var
The variable to plot. Defaults to
var = 1the first variable ofx.- plot_theme
The graphical theme of the plot. Default is
plot_theme = theme_metan(). For more details, seeggplot2::theme().- x.lab
The label of x-axis. Each plot has a default value. New arguments can be inserted as
x.lab = "my label".- y.lab
The label of y-axis. Each plot has a default value. New arguments can be inserted as
y.lab = "my label".- leg.position
The position of the legend.
- size.text
The size of the text in the axes text and labels. Default is
12.- ...
Current not used.
Author
Tiago Olivoto tiagoolivoto@gmail.com
Examples
# \donttest{
library(metan)
ge_eff <- ge_effects(data_ge2, ENV, GEN, PH)
plot(ge_eff)

# }
# }