Menu Path : Monitoring>Engine Monitor |
Read Access Rights:
|
Write Access Rights:
|
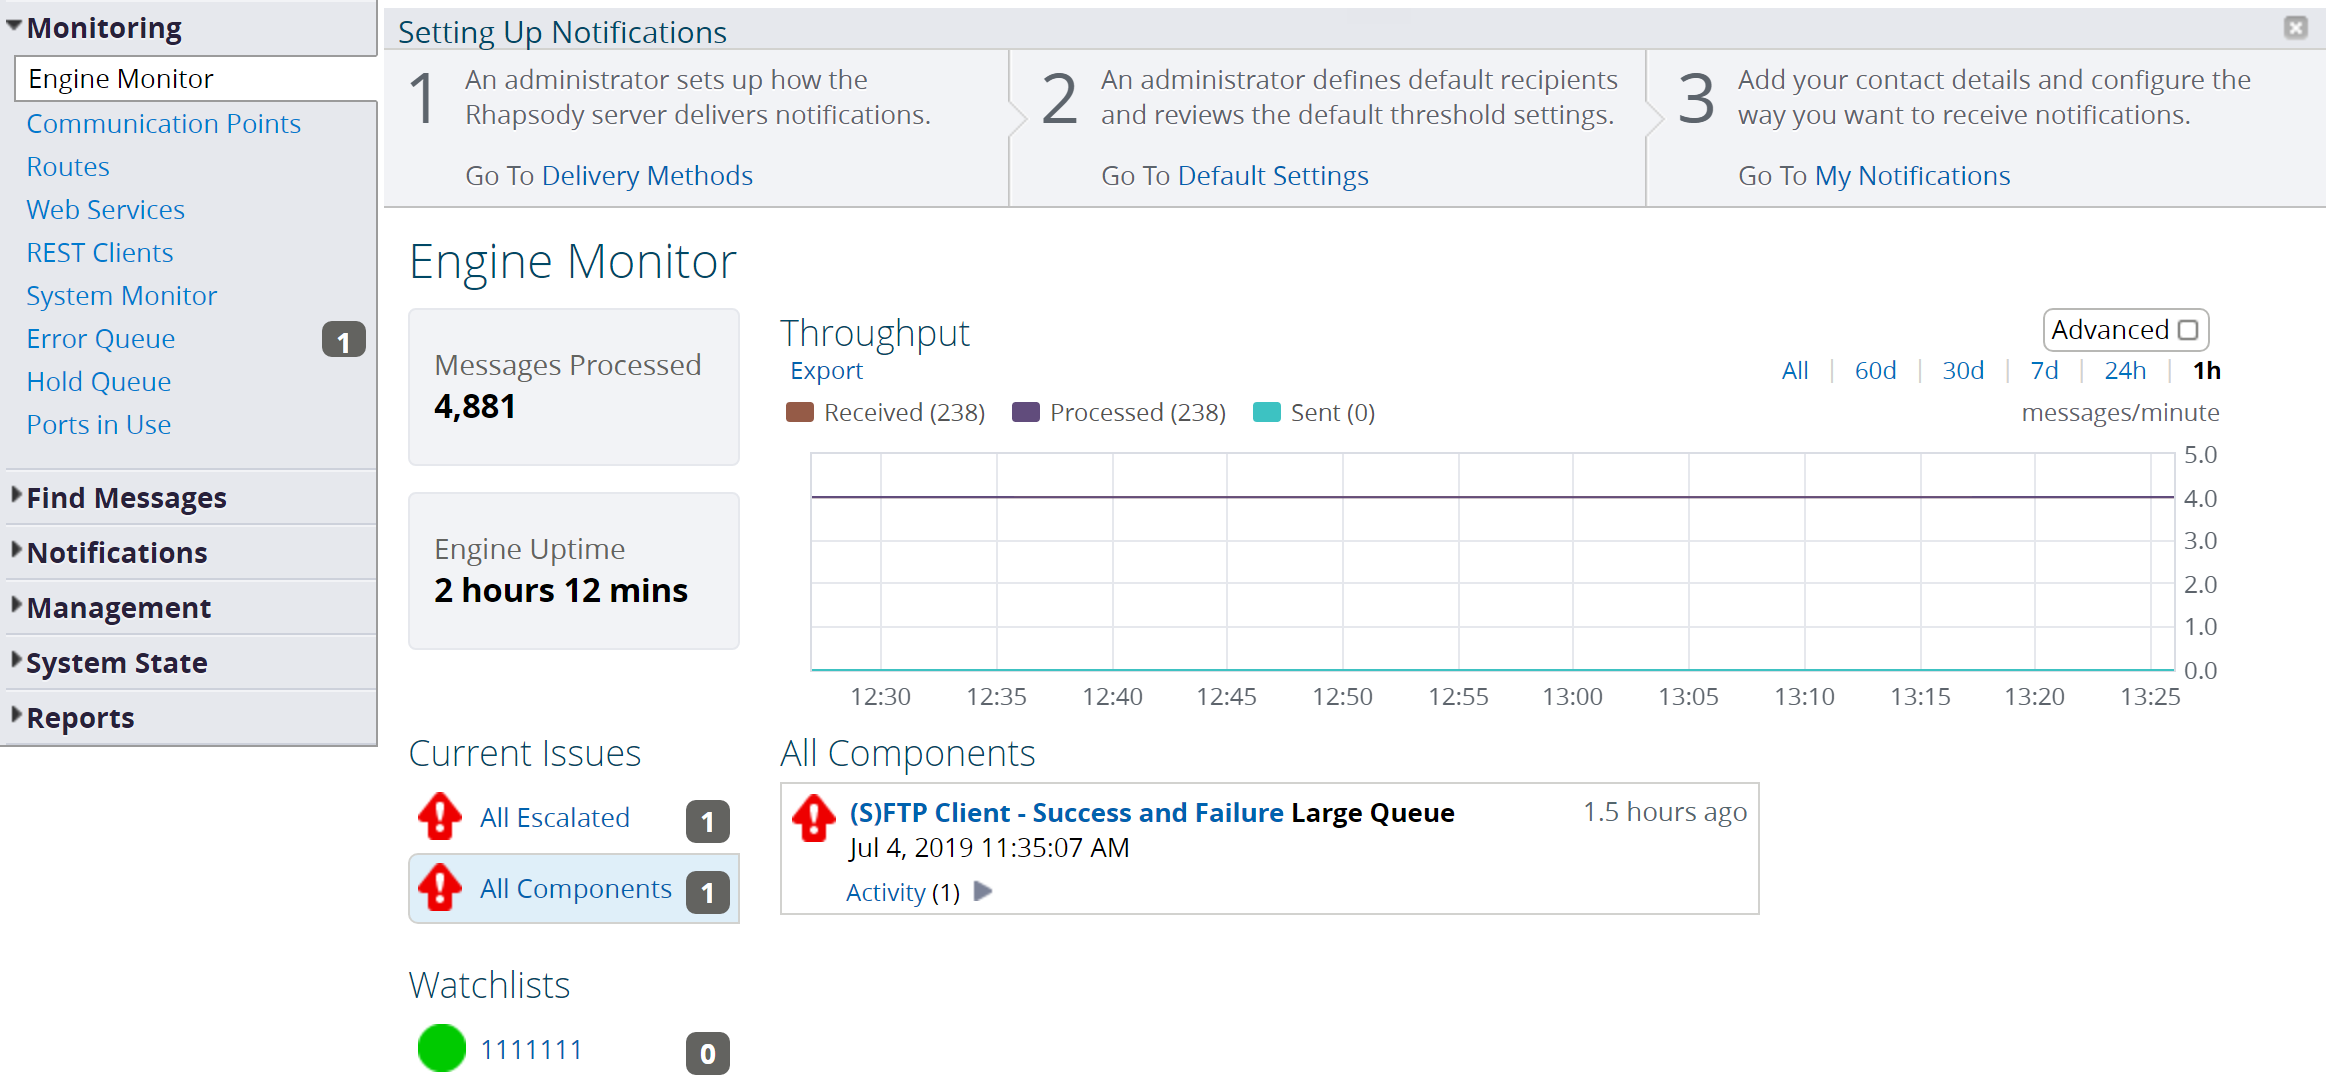
The Engine Monitor page displays a summary of the Rhapsody Engine statistics and lists watchlists and the status of their associated routes and communication points. The page is displayed when you first log into the Management Console and enables you to quickly identify the status of routes and communication points associated with a watchlist; for example, you might group all ADT routes and communication points with an ADT watchlist. The overview page then enables you to quickly view if all communication points and routes associated with that group are running as expected.
The Engine Monitor page consists of the following panels:
Field |
Description |
|---|---|
Messages Processed |
The total number of messages that have been processed since the installation. |
Engine Uptime |
The total time the engine has been running since last started. |
Throughput |
A line graph showing the Received, Processed, Sent and Failed messages which passed through all the components in the engine. This enables you to monitor and view throughput trends. You can alter the display of the graph as follows:
To zoom, click and drag on the graph. The Advanced button enables you to show or hide the Failed line graph. It is hidden by default. To export throughput statistics or all statistics for the system, refer to Exporting Statistics. |
Current Issues |
Displays issues that fall under the All Escalated, Assigned To Me and All Components category. The All Escalated and Assigned To Me links only appear if there are issues that fit the description. However, the All Components link is always displayed and if there are no issues the Green icon is displayed. |
Watchlists |
Displays a list of configured watchlists. A status icon is displayed next to each watchlist representing the severity of issues raised on its components. Refer to Watchlists for details. |
Activity Feed |
Displays components that have Warnings or Alarms raised. This list can be filtered by selecting a filter from the Current Issues or selecting a Watchlist. Every item in the activity feed represents a component. Click on the component name to view the corresponding components details page. Refer to Communication Point Details, Route Details, Web Service Details or REST Client Details for details. When a watchlist is selected, the Settings link is displayed. Click the Settings link to view the Watchlist details. |
How Current Issues Work When Using Lockers
The All Escalated and All Components sections are limited based on which lockers the current user has access rights for. Notifications for specific components in lockers the user cannot view are removed from these sections. In these situations, the count next to the category name is appended with a + icon. The icon indicates that there are more notifications on the engine than the user has permissions to view. A warning message is also presented to the user. The Assigned To Me and Watchlist categories are not delimited.
Three-step Guide for Setting up Notifications
On initial login to the Management Console, a banner is displayed, outlining a three-step guide for setting up notifications:
The three-step guide is not shown for a user in the Monitor user access group, who by default has none of the required access rights.
For each step in the three-step guide there is a description of the task to be completed and a link to the relevant Management Console page:
- Step 1 - Delivery Methods.
- Step 2 - Default Settings.
- Step 3 - My Notifications.
To use the three-step guide:
- Click on the link in the appropriate step to navigate to the page.
- After completing the relevant task on the page and clicking Apply, the step number is replaced with the icon and the link is disabled.
In each step of the guide, the link to a page is shown or hidden, depending on the access permissions that the user has to edit the page. Users in the three user access groups have the following default views of the guide:
User Access Group |
Step 1 |
Step 2 |
Step 3 |
|---|---|---|---|
Administrator |
Shown |
Shown |
Shown |
Developer |
Hidden |
Shown |
Shown |
Monitor |
Hidden |
Hidden |
Hidden |
The relevant access rights are:
- 'Edit notification delivery methods'
- 'Edit unmonitored component notifications'
- 'Edit current user's notification preferences'
Steps 1 and 2 apply to the entire engine, while step 3 and dismissing the three-step guide are applicable on a per user basis.
The three-step guide can be manually dismissed at any time by pressing the icon in the upper right-hand corner. It will automatically disappear when all the steps have been completed.
Exporting Statistics
To export throughput statistics or all statistics for the system:
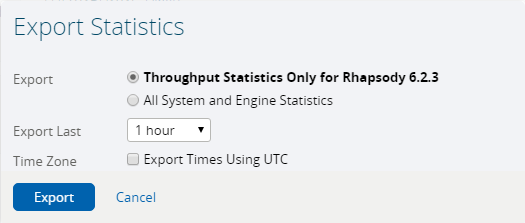
Click the Export link to display the Export Statistics dialog:
Select one of the following radio buttons:
Option
Description
Throughput Statistics Only for <engine name>
Only exports the throughput statistics for the engine.
All System and Engine Statistics
Exports all statistics types for the system.
- Select the collection time period of statistics you want to export from the Export Last drop-down list.
Select the Export Times Using UTC checkbox if you want to export the data using Coordinated Universal Time as the time zone.
If this option is not selected, the data is exported using the local time of the Rhapsody engine, which could potentially result in time discrepancies, if a daylight saving changeover occurs during the period the statistics were collected.
- Select the Export button to export the data to a zipped CSV file.


