

Note
Go to the end to download the full example code.
Pie charts#
Demo of plotting a pie chart.
This example illustrates various parameters of pie.
Label slices#
Plot a pie chart of animals and label the slices. To add labels, pass a list of labels to the wedge_labels parameter.
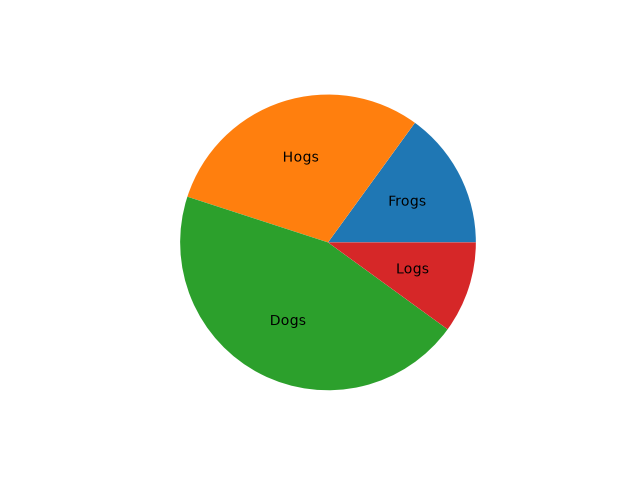
Each slice of the pie chart is a patches.Wedge object; therefore in
addition to the customizations shown here, each wedge can be customized using
the wedgeprops argument, as demonstrated in
Nested pie charts.
Set label positions#
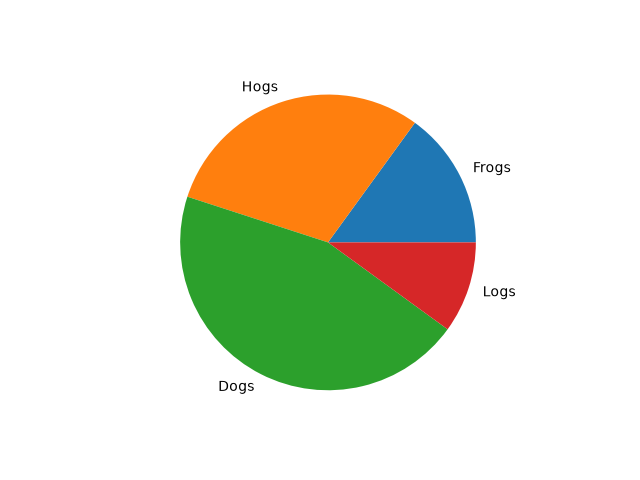
If you want the labels outside the pie, set a wedge_label_distance greater than 1. This is the distance from the center of the pie as a fraction of its radius.
Auto-label slices#
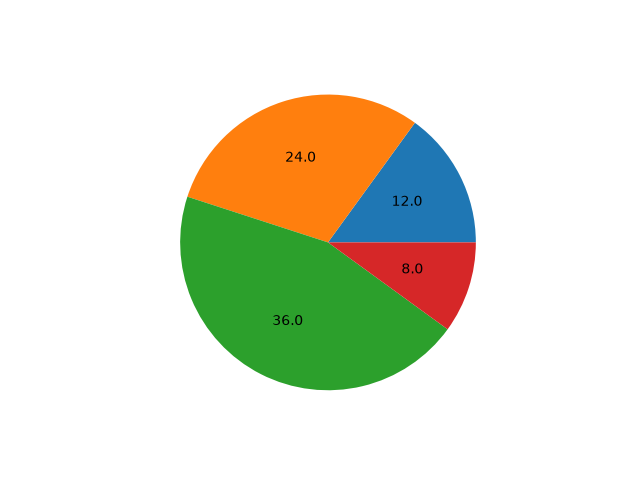
Pass a format string to wedge_labels to label slices with their values...
fig, ax = plt.subplots()
ax.pie(sizes, wedge_labels='{absval:.1f}')
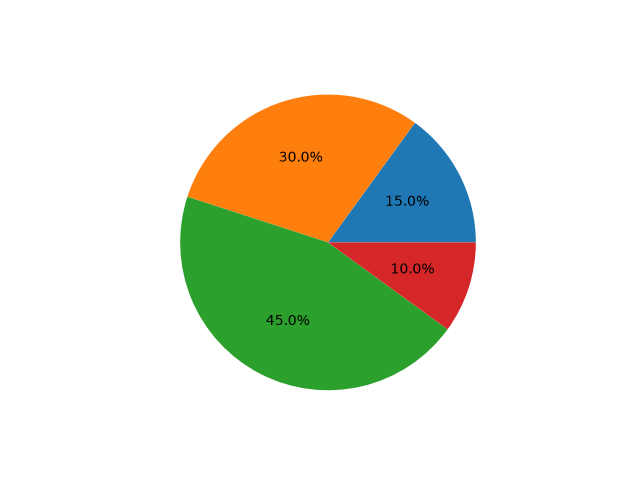
...or with their percentages...
fig, ax = plt.subplots()
ax.pie(sizes, wedge_labels='{frac:.1%}')
...or both.
fig, ax = plt.subplots()
ax.pie(sizes, wedge_labels='{absval:d}\n{frac:.1%}')
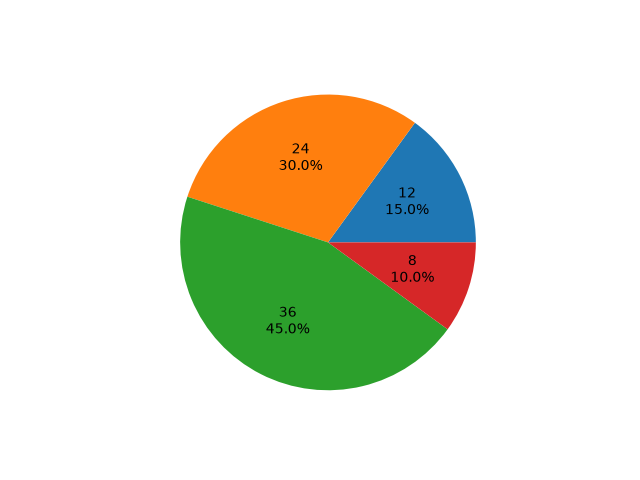
For more control over labels, or to add multiple sets, see Labeling pie charts.
Color slices#
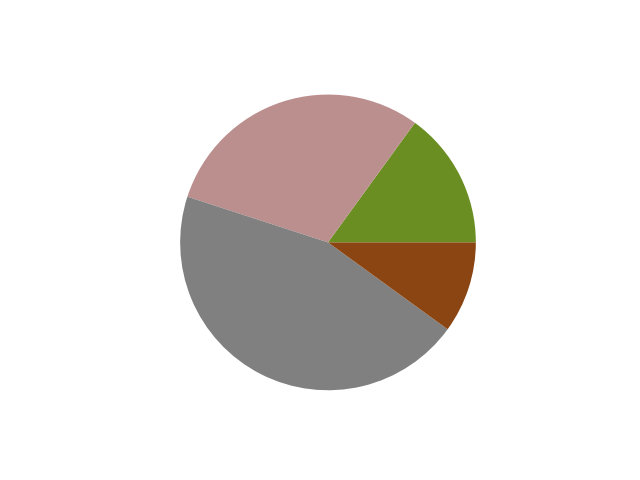
Pass a list of colors to colors to set the color of each slice.
fig, ax = plt.subplots()
ax.pie(sizes, colors=['olivedrab', 'rosybrown', 'gray', 'saddlebrown'])
Hatch slices#
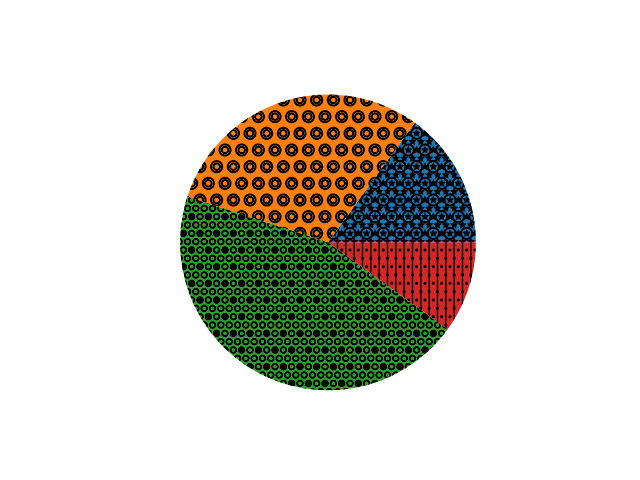
Pass a list of hatch patterns to hatch to set the pattern of each slice.
fig, ax = plt.subplots()
ax.pie(sizes, hatch=['**O', 'oO', 'O.O', '.||.'])
Explode, shade, and rotate slices#
In addition to the basic pie chart, this demo shows a few optional features:
offsetting a slice using explode
add a drop-shadow using shadow
custom start angle using startangle
This example orders the slices, separates (explodes) them, and rotates them.
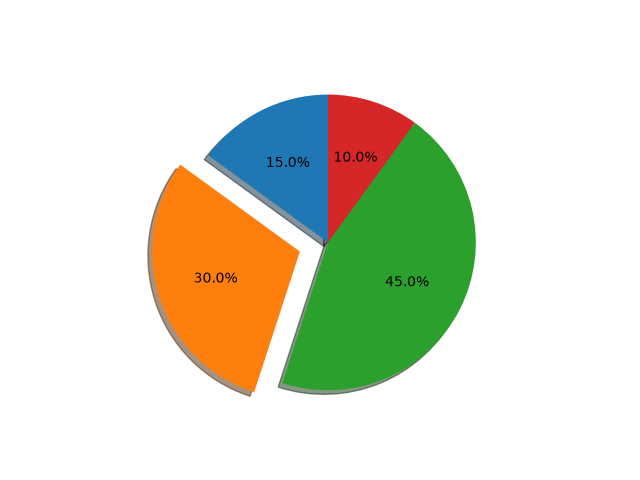
The default startangle is 0, which would start the first slice ("Frogs") on
the positive x-axis. This example sets startangle = 90 such that all the
slices are rotated counter-clockwise by 90 degrees, and the frog slice starts
on the positive y-axis.
Grow or shrink pie#
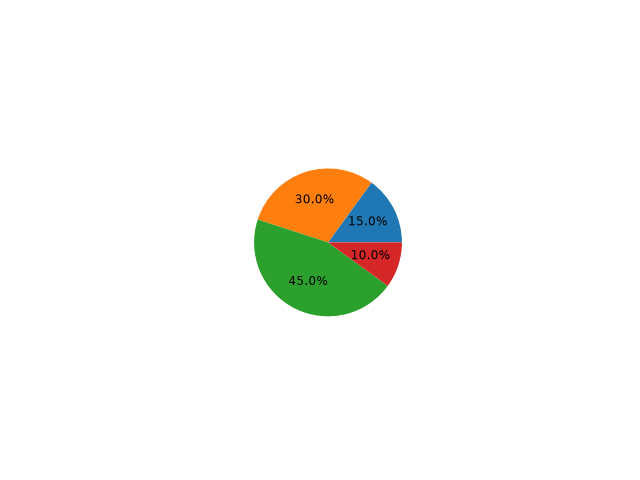
By changing the radius parameter, and often the text size for better visual appearance, the pie chart can be scaled.
Modify shadow#
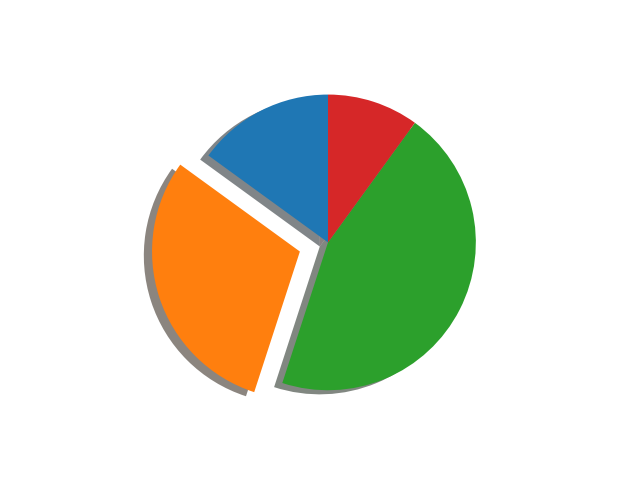
The shadow parameter may optionally take a dictionary with arguments to
the Shadow patch. This can be used to modify the default shadow.
References
The use of the following functions, methods, classes and modules is shown in this example:
Total running time of the script: (0 minutes 11.504 seconds)