

Note
Go to the end to download the full example code.
Date tick locators and formatters#
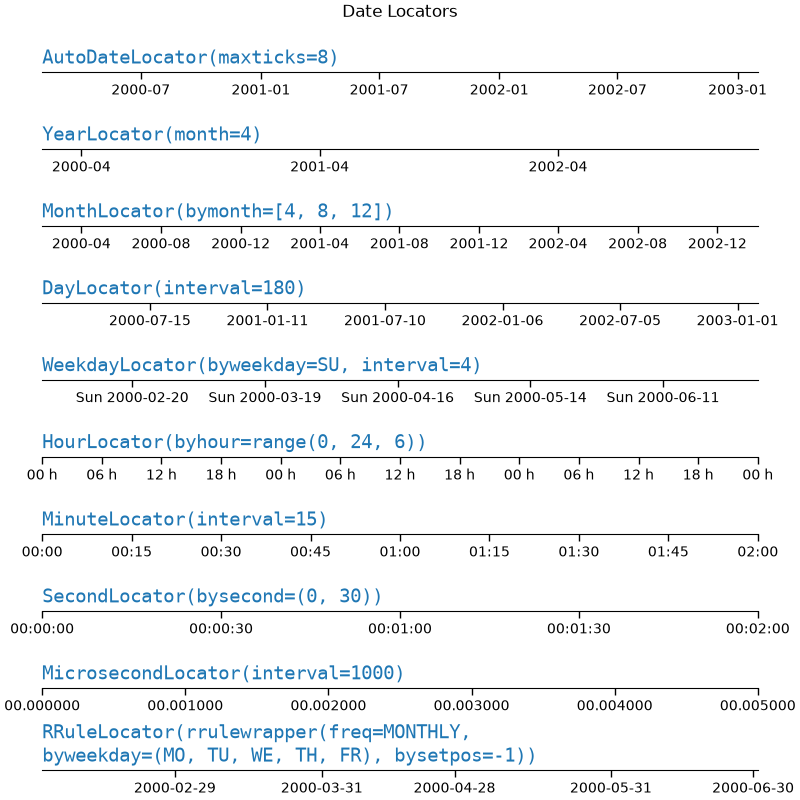
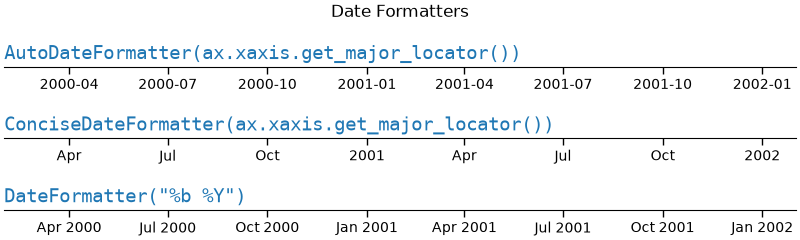
This example illustrates the usage and effect of the various date locators and formatters.
import matplotlib.pyplot as plt
import numpy as np

# While these appear unused directly, they are used from eval'd strings.
from matplotlib.dates import (
    FR,
    MO,
    MONTHLY,
    SA,
    SU,
    TH,
    TU,
    WE,
    AutoDateFormatter,
    AutoDateLocator,
    ConciseDateFormatter,
    DateFormatter,
    DayLocator,
    HourLocator,
    MicrosecondLocator,
    MinuteLocator,
    MonthLocator,
    RRuleLocator,
    SecondLocator,
    WeekdayLocator,
    YearLocator,
    rrulewrapper,
)
import matplotlib.ticker as ticker


def plot_axis(ax, locator=None, xmax='2002-02-01', fmt=None, formatter=None):
    """Set up common parameters for the Axes in the example."""
    ax.spines[['left', 'right', 'top']].set_visible(False)
    ax.yaxis.set_major_locator(ticker.NullLocator())
    ax.tick_params(which='major', width=1.00, length=5)
    ax.tick_params(which='minor', width=0.75, length=2.5)
    ax.set_xlim(np.datetime64('2000-02-01'), np.datetime64(xmax))
    if locator:
        ax.xaxis.set_major_locator(eval(locator))
        ax.xaxis.set_major_formatter(DateFormatter(fmt))
    else:
        ax.xaxis.set_major_formatter(eval(formatter))
    ax.text(0.0, 0.2, locator or formatter, transform=ax.transAxes,
            fontsize=14, fontname='Monospace', color='tab:blue')
Date tick locators#
locators = [
    # locator as str, xmax, fmt
    ('AutoDateLocator(maxticks=8)', '2003-02-01', '%Y-%m'),
    ('YearLocator(month=4)', '2003-02-01', '%Y-%m'),
    ('MonthLocator(bymonth=[4, 8, 12])', '2003-02-01', '%Y-%m'),
    ('DayLocator(interval=180)', '2003-02-01', '%Y-%m-%d'),
    ('WeekdayLocator(byweekday=SU, interval=4)', '2000-07-01', '%a %Y-%m-%d'),
    ('HourLocator(byhour=range(0, 24, 6))', '2000-02-04', '%H h'),
    ('MinuteLocator(interval=15)', '2000-02-01 02:00', '%H:%M'),
    ('SecondLocator(bysecond=(0, 30))', '2000-02-01 00:02', '%H:%M:%S'),
    ('MicrosecondLocator(interval=1000)', '2000-02-01 00:00:00.005', '%S.%f'),
    ('RRuleLocator(rrulewrapper(freq=MONTHLY, \nbyweekday=(MO, TU, WE, TH, FR), '
     'bysetpos=-1))', '2000-07-01', '%Y-%m-%d'),
]

fig, axs = plt.subplots(len(locators), 1, figsize=(8, len(locators) * .8),
                        layout='constrained')
fig.suptitle('Date Locators')
for ax, (locator, xmax, fmt) in zip(axs, locators):
    plot_axis(ax, locator, xmax, fmt)
Date formatters#
formatters = [
    'AutoDateFormatter(ax.xaxis.get_major_locator())',
    'ConciseDateFormatter(ax.xaxis.get_major_locator())',
    'DateFormatter("%b %Y")',
]

fig, axs = plt.subplots(len(formatters), 1, figsize=(8, len(formatters) * .8),
                        layout='constrained')
fig.suptitle('Date Formatters')
for ax, fmt in zip(axs, formatters):
    plot_axis(ax, formatter=fmt)
References
The use of the following functions, methods, classes and modules is shown in this example:
Total running time of the script: (0 minutes 5.046 seconds)