Most basic
Most basic stacked area chart you can build with R and ggplot2, using the geom_area function.
Small multiple
Small multiple is probably the best alternative, making obvious the evolution of each gropup.
Most basic area chart you can build in base R using the polygon function.
Most basic barplot
The most basic barplot you can do with geom_bar(), using default settings.
Custom color
A few examples showing how to custom barplot color.
Horizontal barchart
It makes sense to make your barchart horizontal: group labels are now much easier to read
Bar width
You can control bar width using the width argument of geom_bar()
Control group order
Reordering categories in the barchart is a crucial step for an insightful figure: learn how to do it.
Variable width
A barplot with variable width to represent categories sample size.
Error bars
How to add error bars on a barplot, and why should be careful about it.
Most basic usage of the barplot() function.
Control color
How to control barplot color, how to pick a nice color palette.
General customization
Title, axis labels, axis limits, and more.
Horizontal barplot
A horizontal version of the barplot, thanks to the horiz argument.
Play with bar width and space between bars.
Bar texture
Change bar texture with the density and angle parameters of the barplot function.
Axis features
Change font, color and size of axis labels and titles
Increase margin
Increase margin size with the mar argument of the par function
Add error bars
Add error bars on barplot to show confidence interval or standard deviation
Number of obs
Add number of observation on top of barplot, and other customization
Parameters reminder
A cheatsheet to quickly reminder what option to use with what value to customize your chart.
Base R margins
A post dedicated to margin management in base R.
Basic barplot
The basic barplot hides information: how does the underlying distribution look like? What are the category sample sizes?
Add individual observation
See how low group C sample size actually is?
Violin plot
See group B? It would be a shame to miss out this bimodal distribution.
Most basic boxplot
The most basic boxplot you do using ggplot2.
geom_boxplot() options
An overview of the boxplot options offered by ggplot2 to custom chart appearance.
Changing group order in a boxplot is a crucial step. Learn why and discover 3 methods to do so.
Several examples showing most usual color customization: uniform, discrete, using colorBrewer, Viridis and more.
Most basic histogram 2d
Most basic histogram 2d using the geom_bin2d() function of ggplot2
Color and bin size
Learn how to customize the color and the bin size of your 2d histogram
Most basic, default parameters
change theme
Use the theme_bw() for better appearance
Learn how to customize the color and the bin size of your hexbin chart
Hexbin package
Build a hexbin chart with the hexbin package and color it with RColorBrewer
Scatter on top of 2d distribution
Add a scatterplot on top of the ggplot2 2d density chart
3D knot
A 3D knot to illustrate what is possible to do with rgl.
Nifty graph
A contribution by Matt Asher.
3D animation
A 3D animated scatterplot made with R and rgl.
Scatter / bubble
Check how to animate a bubble or scatterplot to visualize evolution over time.
Any customization offered by ggplot2 can be used in gganimate. Here is an illustration using small multiple.
Barplot transition
A transition between 2 states in a barplot, smoothly.
Line apparition
A line chart progressively displayed.
A Count-down animation made with R and Image Magick.
Another example of 3d and animation with R and lattice.
Most basic area chart with R and ggplot2
Improve appearance
Use a theme, highlight top line, add points if needed, and more options.
Log transform
How to use a log transformation for the Y axis with scale_x_log10().
Highlight a group
Learn how to highlight a group on your chart to convey your message more efficiently.
Grouped boxplot
A grouped boxplot displays the distribution of several categories organized in groups and subgroups
Faceting in boxplot
An alternative to grouped boxplot where each group or each subgroup is displayed in a distinct panel.
It is possible to make the box widths proportionnal to category sample size.
Boxplot from continuous variable.
how to build a boxplot with ggplot2 where categories are actually bins of a numeric variable.
Add mean value.
Explaines how to add mean value on top of boxplot. (remember boxplot displays the median, not the mean).
Boxplot downside is to hide information. You can reveal box underlying distribution showing individual observations with jitter.
Marginal distribution
Add marginal distribution around your scatterplot with ggExtra and the ggMarginal function.
Boxplot on top of histogram
How to add a boxplot on top of a histogram.
Boxplot with custom colors
Color specific groups in this base R boxplot using ifelse statement.
X axis labels on several lines
How to display the X axis labels on several lines: an application to boxplot to show sample size of each group.
Boxplot with jitter
Show individual observations on top of boxes, with jittering to avoid dot overlap.
Order categories by median
Learn how to reorder categories using increasing median.
Boxplot with specific order
Learn how to reorder categories with a specific order.
Grouped and ordered boxplot
How to build a grouped boxplot (groups & subgroups) and order it by increasing median.
Boxplot with variable width
Make box size proportional to category sample size.
Boxplot with labels on top
Add labels on top of each category to display custom information like category sample size.
Tukey test
Tukey test compares the mean of all pairs of category. Here is how to perform it and represent its result on a boxplot.
Box type around plot
Learn how the bty argument of the par() function allows to custom the box around base R plot.
Split plot window with layout()
Layout() divides the device up into as many rows and columns as need, with custom proportions.
Basic bubble chart
The most basic bubble chart you can build with R and gglot2 with geom_point()
Control bubble size
Control bubble size with scale_size(): allows to set minimum and maximum size.
Make your chart pretty with nice color scale, general theme, stroke around cirle and more..
Add Markers
Learn how to add a marker on a map with leaflet. Circle, rectangle, pointer and more. Link it to tooltip.
Bubble map
Lear to map the marker size to a numeric value, resulting in a bubble map.
Interactive legend
You can add tags to marker and build an interactive legend that allows to toggle their visibility.
Cartography pkg
Check the cartography package to build great maps in minutes with R.
Most basic map
Before building any cartogram, you need to understand how to build a basic map background. Here is how.
Most basic cartogram
Learn how to distort region shape using the cartogram package.
Switch to choropleth
Next step is to color each region according to their value, on top changing their size.
Basic Hexbin Map
Start with an usual hexbin map.
Apply Cartogram method
Apply a cartogram algorithm to distort hexagon size according to a numeric value.
Customization
Customize the previous chart: legend, color palette, title, state name and more..
Data from the package
The cartography comes with a set of geospatial data included. Learn how to use it to build a choropleth map.
The most basic circular packing you can build..
Color customization
Change colors, map the palette to a variable, customize background and more.
Space between bubbles
Add space between bubbles by reducing bubble size according to a constant.
The most basic circular packing you can build with R and ggraph
Add color
Learn how to map the bubble color to the hierarchy level
Add labels
Add labels to nodes to give more insight to the chart
Hide levels
Hide some levels of the hierarchy for a more stylish chart
Specific labels
Add labels to specific levels of the hierarchy
The most basic circular barchart you can build, to illustrate how coord_polar() works
Add labels with geom_text(). Tricky, since you have to compute label angles first.
Add a gap
Lear how to add a gap in the circle. The same technique will then be used to add gaps between groups
Gap between groups
The space between groups allows to highlight them.
Order
As usual, it makes sense to order bars of each group to get the ranking more easily
Add scale, group names and more
Basic usage
Basic usage to build a 5 color long palette.
Longer palette
Get a longer color palette from RColorBrewer.
Available palette
See the complete list of available palettes.
Categorical palette
How to map a color to a categorical variable.
Continuous palette
Same thing for a continuous variable.
Two histograms on same Axis
Compare the distribution of 2 variables with this double histogram built with base R function.
Histogram with colored tails
Coloring tails sometimes allow to highlight specific areas of the distribution.
Color and legend
Customize color and legend of the dendrogram.
Most basic scatterplot with R and ggplot2
Custom appearance
Classic appearance customization with theme_ipsum and more
Connected Scatter for evolution
Use connected scatterplot with 3 numeric variable to show an evolution.
How to add a legend to base R plot
The legend() function allows to add a legend. See how to use it with a list of available customization.
Image on the chart background
The rasterImage function allows to add an image on the background of the chart.
Manage date data
Learn why it is important that your date is recognized at the date format, and how to do so.
Background map and circle
Start by remembering how to plot a absic background map with circles to show 3 cities
Add a few connections
Add a few connections using great circles and the lines() function.
Loop the process
Build a loop to display many connections. Add city names. Gert fancy.
Scatterplot matrix
Basic scatteprlot matrix with the ggpairs() function.
Pearson correlation
Visualize correlation with ggcorr().
Show groups
You can use the ggplot2 syntax to add aesthetics and ths map color to categories.
Square and Pie
How to use the corrgram() function to represent correlation with square and pie charts.
Ellipse + Scatterplot
Visualize correlation with corrgram(). Use ellipses and scatterplots
Half matrix
You can display correlation in half the matrix only.
Ellipse package
The ellipse package allows to visualize a correlation matrix with ellipses.
plot() function
The plot function is straightforward way to build a basic scatterplot matrix.
car package
The car package probides a scatterplotMatrix function to build correlogram.
Most basic dendrogram
Most basic usage of ggraph, applied on 2 types of input data format.
Dendrogram customization
Go further with ggraph: edge style, general layout, node features, adding labels, and more.
Customized circular dendrogram
Learn how to build a circular dendrogram with proper labels.
Basic clustering process
Learn how to format your data, compute distance between samples, run the clusterisation and visualize the result.
Zoom / Select
Zoom on a specific part of the tree to study a particular group more in detail.
The set() function
An introduction to the set function that allows to customize node and label features.
Horizontal
Flip the tree to get it horizontal, and use coloring to highlight clusters.
Highlight a specific group with a rectangle on top.
Bottom bar
Add a colored bar on the bottom of the tree to check an expected distribution.
Face to face
Put 2 dendrogram face to face to compare their clustering result.
The most basic density plot you can do with ggplot2.
Use the theme_ipsum to improve the general appearance of the previous basic density chart.
Mirror density chart
Put 2 density charts face to face to compare the distribution of 2 numeric variables.
Multi density chart
Explains how to display several density charts on the same axis, and the potential associated caveats.
Multi density with annotation
It is a good practice to write group names next to shapes instead of adding a legend beside the chart.
If you have several groups, plotting them on the same axis often results in a cluttered and unreadable figure. Use small multiple to avoid that.
Stacked density chart
Stack groups on of top of each other. Allows to study the whole, but makes it hard to study each group.
How to build the most basic donut chart with R and ggplot2
Make it prettier with labels, nice color palette and better general appearance
Ring width
Control ring thinckness with xlim
xlim
Basic donut chart with base R, no library involved.
Annotate with geom_text
geom_text() allows to add annotation to one, several or all markers of your chart.
Annotate with geom_label
Very close to geom_text, geom_label produces a label wrapped in a rectangle. This example also explains how to apply labels to a selection of markers.
Rectangle
Learn how to use the annotate function to add a rectangle on a specific part of the chart.
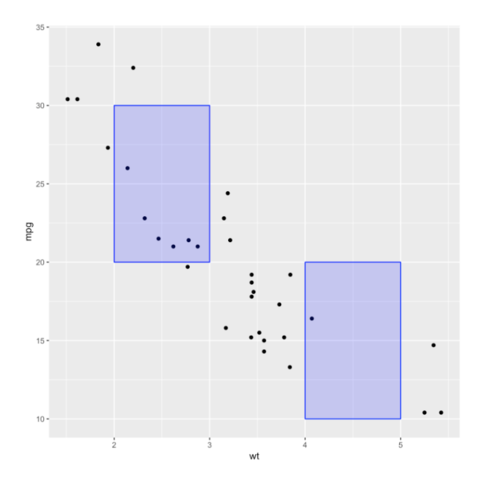
Segment
How to add one or several segments to the chart.
Arrow
Basically the same as for a segment, with just one additional argument.
Abline
Add horizontal or vertical ablines with geom_hline and geom_vline.
Scatterplot with rug
Add rug on X and Y axis to describe the numeric variable distribution. Show how geom_rug() works.
Marginal boxplot
Using boxplots is another way to show the marginal distribution. Find more in this post.
Axis
Customize ggplot2 axis: title, line, labels and ticks.
Background
Customize ggplot2 background: color, major and minor grid lines.
Legend
Customize ggplot2 legend: position, title, text, key symbol and more.
Basic
Learn how to add a title with ggtitle, default options.
Appearance
Learn how to change title font, size, color, text and more.
Position
Check how to change title position.
Facet_wrap
Facet wrap allows to build small multiples using one categorical variable.
Facet_grid
Same idea, but using 2 categorical variables for the faceting.
Customized
An advanced examples to make sure you know how to make your small multiple pretty.
Strip features
Customize the general layout with the strip option.
Mixing charts
How to combine several charts together with ggplot2.
Violin + boxplot + sample size
This examples provides 2 tricks: one to add a boxplot into the violin, the other to add sample size of each group on the X axis
Map marker feature to variable
Ggplot2 makes it a breeze to map a variable to a marker feature. Here is an example where marker color depends on its category.
Improve general appearance
Add title, use a theme, change color palette, control variable orders and more
Conditional color
Change shape parameters depending on where the data points is located compared to a threshold.
Cleveland dot plot
A variation of the lollipop chart to study several categories on the same chart.
Usual customizations like title, theme, color palette and more.
Droid
A BB8 droid made using R and ggplot2.
Random Shapes
A piece of generative art built with R and ggplot2.
R Snail
R Snail, a generative figure made by Christophe Cariou, built with R.
Most basic heatmap
The most basic heatmap you can build with R, using the heatmap() function.
Control the color palette used in the heatmap. Several methods shown.
Color scheme on the side
Add color beside the heatmap to compare actual structure with the expected one.
Most basic usage of geom_tile to build heatmap
Interactive version
It's very easy to turn your heatmap interactive with ggplotly, check it out!
Most basic use of the levelplot() function of the lattice package.
Reorder and swap X and Y axis
How to control row and column order on your heatmap.
Color palettes
How to use common color palette: R natives, R Color Brewer and Viridis.
Heatmap with smoothing
The latticeExtra allows to add a layer of heatmap with smoothing.
The most basic hexbin map you can do, just plotting the boundaries.
Add state names
This examples explains how to compute the hexagone baricenters to add labels.
Basic Choropleth
Color each hexagone with a color that represents a numeric value. It's a hexbin choropleth map.
Start with a hierarchical network
Hierarchical Edge Bundling is based on a hierarchy. An original node gives underlying nodes and so on. Final nodes are called leaves, displayed around the circle.
Draw a connection
The second required level is connection, stored in another dataset. Leaves are connected with curves instead of straight lines.
Most Basic Edge Bundling
This is the most basic hierarchical edge bundling you can build. It displays many connection between leaves.
Uniform color
You can use one unique color for all connections
Color depending on value or index
Color can also depends on value to represent the strength of the connection, or on the the node index.
Custom nodes
Change node features to display one more level of information on the chart
The most basic histogram you can do with R and ggplot2.
Control bin size
Playing with histogram bin size is an important step. Histogram appearance can greatly change, and so does the message you're trying to convey.
Mirror histogram
The mirror histogram allows to compare the distribution of 2 numeric variables.
Multi histogram
How to display several histograms on the same X axis
Using small multiple and histogram allows to compare the distribution of many groups with cluttering the figure.
Two histograms on split windows
Compare the distribution of 2 variables plotting 2 histograms one beside the other.
Mirrored histogram in base R
A mirrored histogram allows to compare the distribution of 2 variables. Here is how to build one in base R.
Get rid of borders
Just a small tip to get rid of histogram borders and improve the general appearance.
Most basic line chart with R and ggplot2
Basic customization
Basic customization to improve the line chart: size, color, type, theme, title and more
Deal with date
How to avoid struggling with dates on the X axis
Basic Grouped line chart
How to build a line chart representing several groups
Customized Grouped
Pick up a nice color palette, use a theme, add titles, and more.
Linear trend
geom_smooth allows to add the result of a model to your scatterplot, with confidence interval as well.
Annotation
Annotation allows to highlight main features of a chart. Learn how to add text, circles, lines and more.
Geom_smooth()
Geom_ribbon()
If you already know the upper and lower limits of the error envelop, geom_ribbon will plot it for you.
Spaghetti chart
Too many lines with 10+ legend entries? You are building a spaghetti chart and readers will struggle to get info from it.
Try to understand what really matters, highlight it and annotate it to make sure people get your point.
Split the layout: each group having its own space. It makes it easier to understand what's happening for each them.
Line color and Y value
Change the line color according to the Y axis value
Reversed Y axis
Learn how to flip the Y axis upside down using the ylim argument.
Polynomial curve
Line charts are often used to represent the result of a statistical model.
Line chart with 2 series
A classic line chart with 2 series, only 1 Y axis.
Dual Y axis line chart
Add a second Y axis for the second sery. See how chart conclusion gets different and wrong.
Add legend
Add a legend to specify what color is linked to what value.
Understand the basics of lollipop chart with this most simple version.
Customize markers
See the different options allowing to customize the marker on top of the stem.
Customize stems
See the different options allowing to customize the stems.
General appearance
How to use the theme() function to improve your chart genereal appearance.
Horizontal version
Make your lollipop chart horizontal → your labels will be easier to read
Change baseline
Change the baseline to highlight an interesting threshold.
Changing group order in a lollipop chart is important to add insight to the chart. Learn why and discover 3 methods to do so.
Highlight one or several groups to convey your message more efficiently. Play with group appearance and add text annotation.
The most basic background map you can do with R and the leaflet package. Default options only.
Zoom and Location
Learn how to zoom on a specific part of the map with the setView function.
Change tile
Several background tiles are offered by leaflet. Learn how to load them, and check the possibilities.
Read and plot Shapefiles
learn how to read and plot shapefiles thanks to the rgdal package.
Read and plot geoJSON files
learn how to read and plot geoJSON files thanks to the geojsonio package.
Select
How to select one or several regions in a geospatial object, and plot it.
Simplify
Simplifying a geospatial object allows to get a lighter object that will be plotted faster.
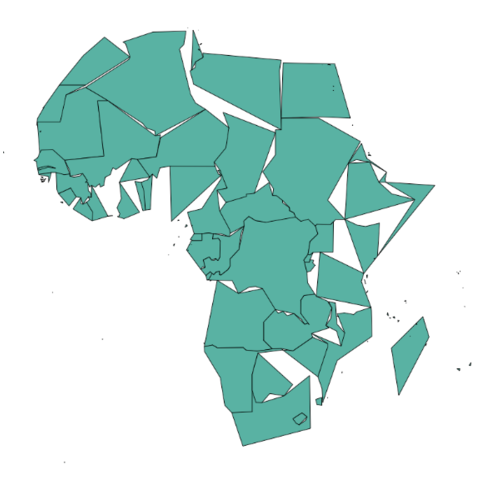
Centroid
Computing region centroids is a common task: it allows to add region labels afterwards.
Intro
An introduction to network diagram with R and the igraph package.
Explore all the parameters offered by the igraph package to customize chart appearance.
Layout algorithm
Several layout algorithm are offered by the igraph package. Learn how to use them and what are the possibilities.
Map variable to feature
Learn how to change node and link features according to external variables.
Clustering viz
Network diagrams can be used to visualize the result of correlation matrix.
Node size and edge #
Learn how to map node size to its number of links.
Most basic parallel chart
Most basic option using the ggparcoord() function of the ggally package
Highlight a group of interest to help people understand your story
Most basic option using the parcoord() function of the MASS package
Reorder variables
Reordering variables allows to avoid line crossings, and thus makes the chart more understandable
You are interested in a group compared to all the others? Highlight it.
Most basic piechart using the pie() function of base R.
Learn how to change pie shape, zoom in, add stripes, change labels and more.
Colors
How to pick a nice color palette and apply it to the piechart
Explains how to use coord_polar() on a barchart to get a pie chart
Make it clean
Clean the basic piechart: remove background, grid, axis labels
Add Labels
Compute and add labels on each slice, the trickiest part of the job.
Most basic ridgeline
The most basic ridgeline plot you can build with the ridgelines R package.
Distribution shape
Custom the distribution shape, here applying a histogram shape using binning.
Color gradient
Apply a color gradient to the chart. Makes the color scaled to the numeric variable.
Basic scatterplot
The most basic scatterplot you can build with R and ggplot2.Simply explains how to call the geom_point() function.
geom_point()
Custom marker features
The geom_point() function has option to custom color, stroke, shape, size and more. Learn how to call them.
Map to several features
Extension of the previous concept: several features can be mapped to variables in the same time
Most basic scatterplot
The most basic scatterplot you can build with R, using the plot() function.
plot() parameters
Custom your scatterplot with the arguments of the plot() function.
Set a linear model with lm(), and plot it on top of your scatterplot with line().
Confidence interval
Add a confidence interval around the polynomial model with polygon().
Lattice XYplot()
The lattice XYplot() allows to build one scatterplot for each level of a factor automatically.
Correlation of discrete variables
Make the circle size proportional to number of data points when working with discrete variables.
the mtext() function
mtext() allows to add text in margin. Useful to add an unique title for several charts.
split_screen() function
Split screen allows to split the chart window in several sections.
Split screen with par(mfrow())
The easiest way to split the graphic window is to use par(mfrow()).
Most basic radar
Start with a basic version, learn how to format your input dataset
Radar chart customizations
How to customize the chart appearance, polygon, net, labels and more.
Basic multi-group radar chart
Customization option offered by the fmsb package
About axis limits
Learn how to control chart axis limits
Reorder
Learn different methods to reorder the groups from top to bottom
Percent stacked
Switch to a stacked percent area graph where the sum of each time point is 100
The issue with stacking.
Try to understand how the green group evolved on the period. Pretty hard isn't it?
Line chart.
Switch to a line chart to understand better how each group behaved during the period.
Basic grouped barplot
The most basic grouped barplot you can build with R and ggplot2.
Basic Stacked barplot
Instead of having subgroups one beside another, they are on top of each other.
A parcent stacked barchart with R and ggplot2: each bar goes to 1, and show the proportion of each subgroup.
Apply some classic customization like title, color palette, theme and more.
Small multiple can be an alternartive to grouped barplot.
Most basic streamchart
The most basic streamchart you can build with R and the streamgraph package.
Grouped barplot
How to build a grouped barchart with base R
Stacked barplot
Put subgroups on top of each other in a stacked barplot
Percent stacked barplot
Compare proportion in the whole with a percent stacked barchart
Likert package
The Likert package allows to build visualization for questionnaire answers
Change offset
By default a streamchart is displayed all around a horizontal line. You can change that thanks to the offset option
Change shape
Leave the smooth and rounded option to get something similar to a stacked area chart or to a stacked barplot.
Change color
Several ways to change the color palette used on the chart.
Most basic line chart with R and ggplot2 for time series data visualization
X labels
Customize the X axis labels with any date format
Time frame
Select the time frame of interest in your input data
The most basic time sery visual you can build with the dygraphs library. Explanation about possible input formats.
Several series
How to display several series on the same chart.
Area chart
Build an interactive area chart for time series with dygraphs.
Candlestick
Build an interactive Candlestick chart for time series with dygraphs.
Add confidence interval around interactive line chart for time series with dygraphs.
Step plot
Build an interactive step plot for time series with dygraphs.
Most basic treemap
Start with the most basic treemap you can build. No customization, no subgroups, easy code.
Multi-level treemap
How to build a treemap with group and subgroups.
Customize treemap labels, borders, color palette and more
Most basic Venn diagram
This is the most basic venn diagram you can build with R and the VennDiagram package.
Description of the long list of options available to customize the venn diagram.
Application to a real dataset: the lyrics of 3 famous French singers.
Most basic violin chart
Most basic violin using default parameters.Focus on the 2 input formats you can have: long and wide
Changing group order in your violin chart is important. It adds insight to the chart. Learn why and discover 3 methods to do so.
Flipping X and Y axis allows to get a horizontal version. Group labels become much more readable
Grouped violin chart
A grouped violin displays the distribution of a variable for groups and subgroups. Here is an implementation with R and ggplot2
Vioplot package
Vioplot
The vioplot package allows to build violin charts. Learn how it works.
vioplot
Most basic wordcloud
See what input file is needed to run the basic wordcloud2 function with default parameters.
Text color: random
Change word color to random dark
Text color: 2 colors
Provide a vector of color.
Background color
How to change the background color with the backgroundColor argument
Available shapes
A few shapes are available to be used as Masks.
Your image as a mask
You can use any image as a mask.
Text rotation
Chinese version
Use a letter as a Mask
Use a word as a Mask
See what input file is needed to build this basic wordcloud.
Text analysis
A text analysis by Benjamin Tovarcis for document classification.