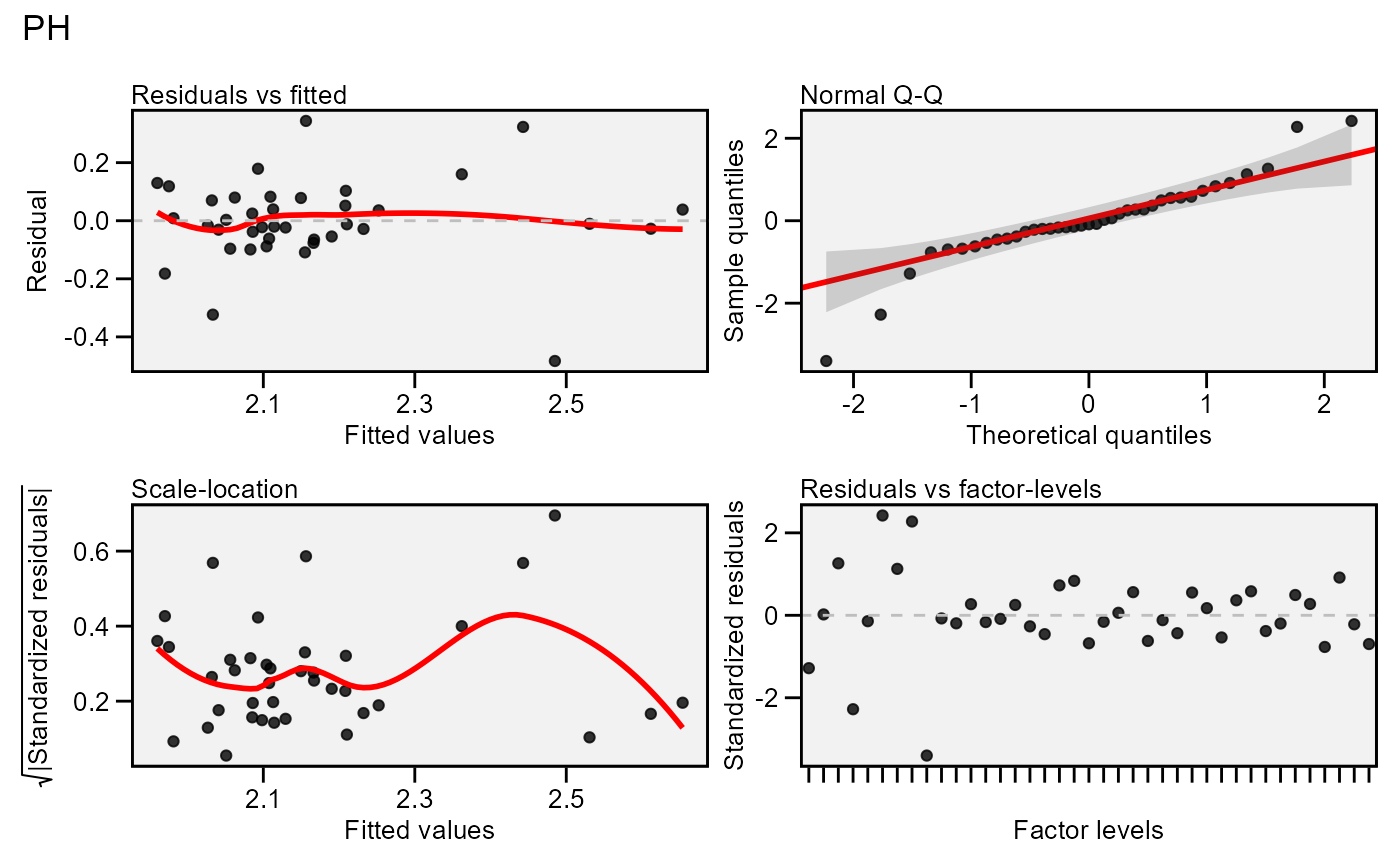
Residual plots for a output model of class gafem. Seven types
of plots are produced: (1) Residuals vs fitted, (2) normal Q-Q plot for the
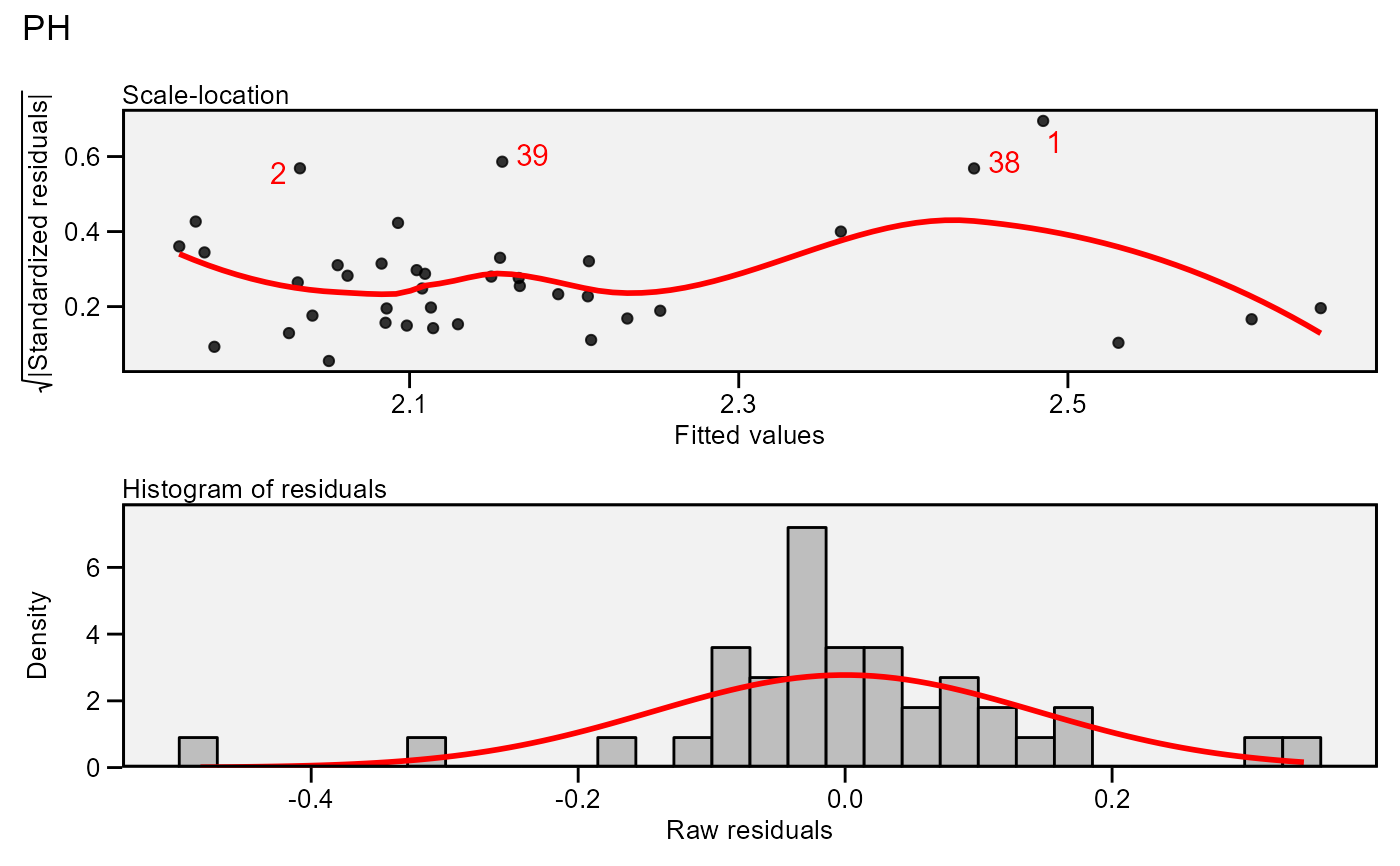
residuals, (3) scale-location plot (standardized residuals vs Fitted Values),
(4) standardized residuals vs Factor-levels, (5) Histogram of raw residuals
and (6) standardized residuals vs observation order, and (7) 1:1 line plot.
Usage
# S3 method for gafem
plot(x, ...)
Arguments
- x
An object of class
gafem.- ...
Additional arguments passed on to the function
residual_plots()
Author
Tiago Olivoto tiagoolivoto@gmail.com
Examples
# \donttest{
library(metan)
model <- gafem(data_g, GEN, REP, PH)
#> Evaluating trait PH |============================================| 100% 00:00:00
#> ---------------------------------------------------------------------------
#> One-way ANOVA table (Randomized complete block design)
#> ---------------------------------------------------------------------------
#> model PH
#> REP 0.2328
#> GEN 0.0239
#> Residuals NA
#> ---------------------------------------------------------------------------
#> Variables with nonsignificant genotype effect
#>
#> ---------------------------------------------------------------------------
#>
plot(model)
 plot(model,
which = c(3, 5),
nrow = 2,
labels = TRUE,
size.lab.out = 4)
plot(model,
which = c(3, 5),
nrow = 2,
labels = TRUE,
size.lab.out = 4)
 # }
# }