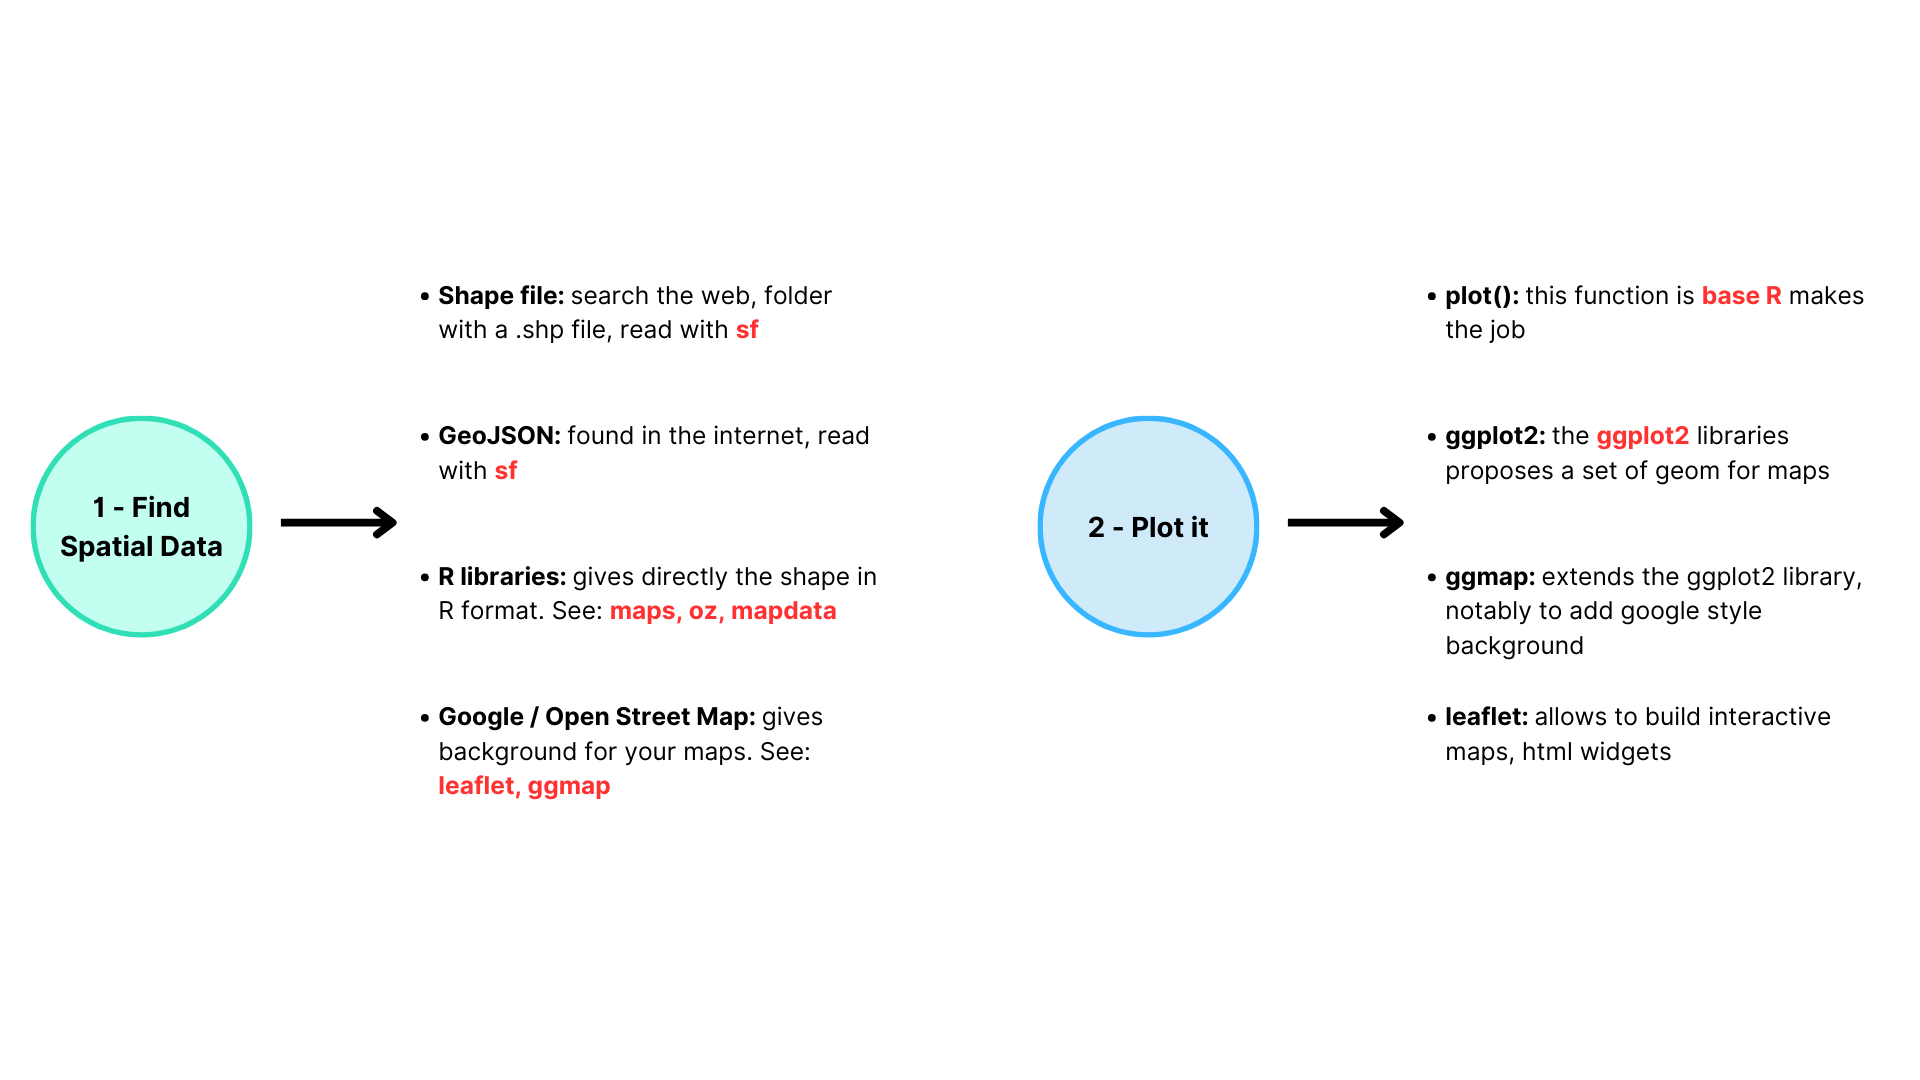
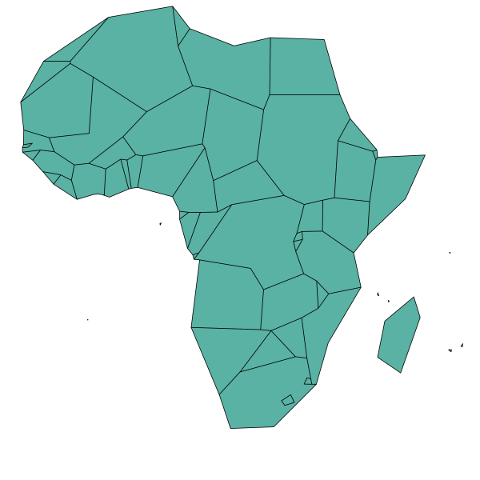
R is a great tool for geospatial data analysis. Heaps of dedicated packages exist. Building a map follows those 2 steps:
Find data, load it in R: region boundaries can be stored in shapefiles or geoJSON files. Some R libraries also provide the data for the most common places. It is also possible to use google map style backgrounds.
Manipulate and plot it: once geo data are loaded in R you get a geospatial object that has specific features. You can manipulate it and plot it with packages like sp or ggplot2
The leaflet R package is a wrapper of the Javascript leaflet.js library. It allows to build stunning interactive maps in minutes with R. Maps can be exported and standalong html files, or be embeded in a R markdown file or a shiny application.
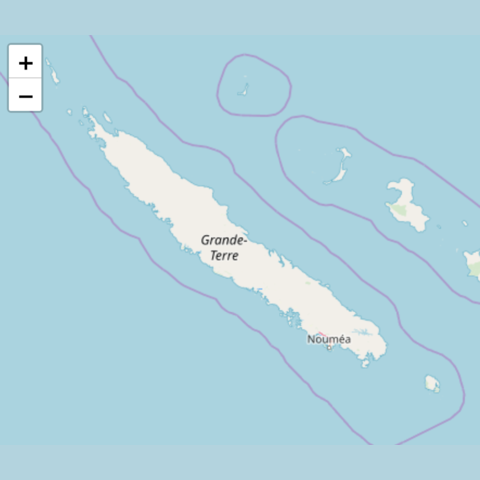
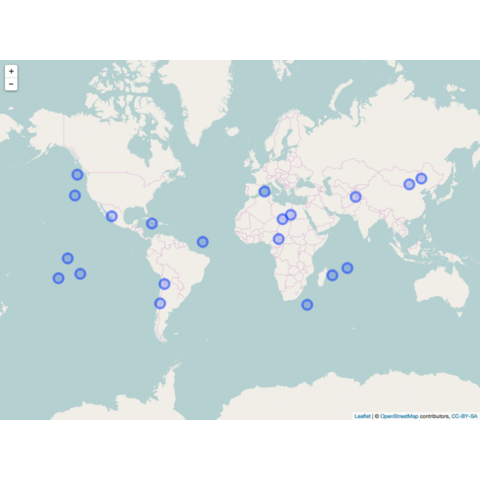
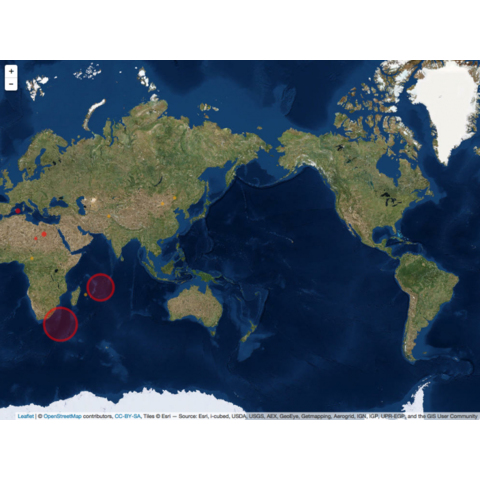
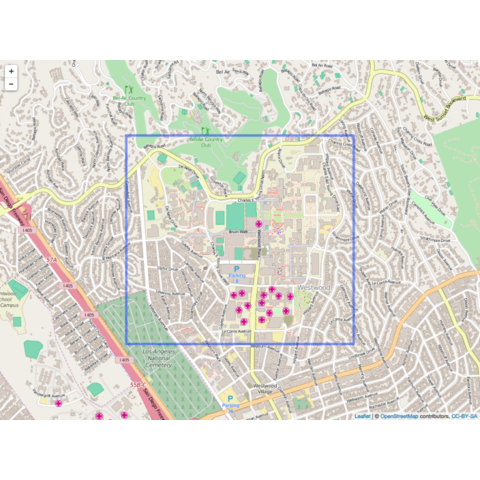
Leaflet maps are interactive: try to zoom and drag.
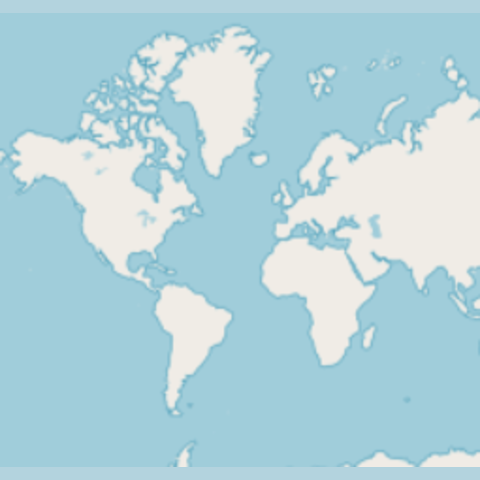
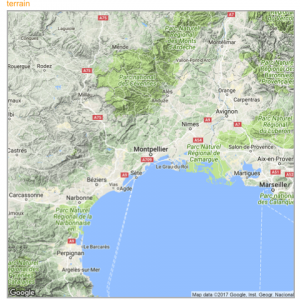
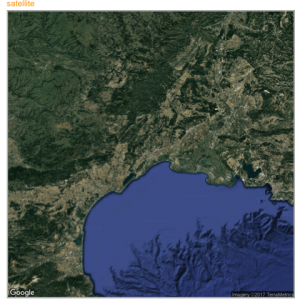
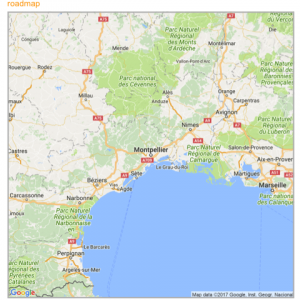
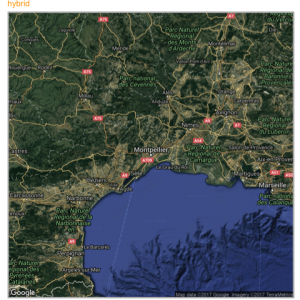
See Codeggmap package for static maps with background tilesThe ggmap library makes it easy to retrieve raster map tiles from popular online mapping services like Google Maps, OpenStreetMap or Stamen Maps, and plot them using the ggplot2 framework. It produces static maps like these. Click on an image to get the related code snippet.
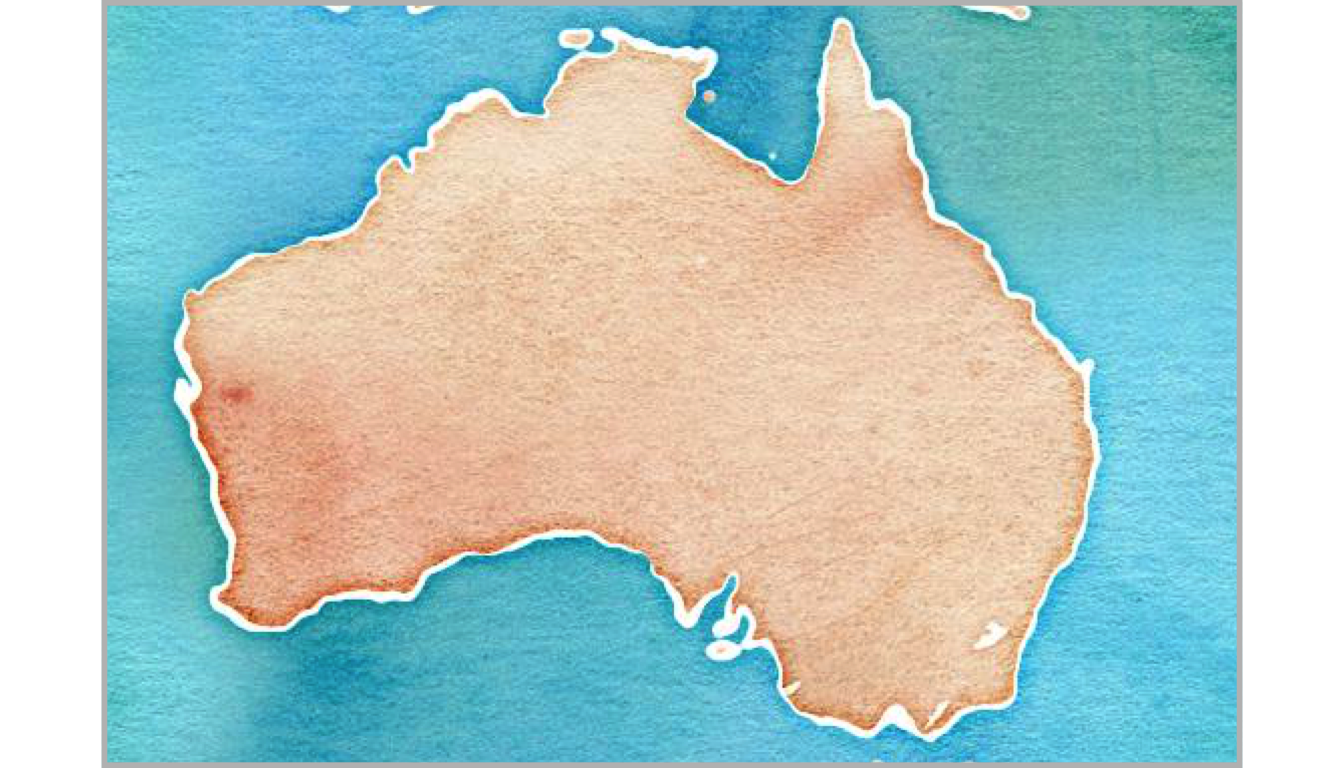
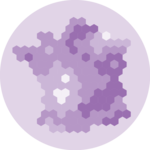
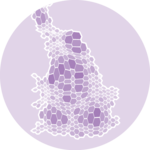
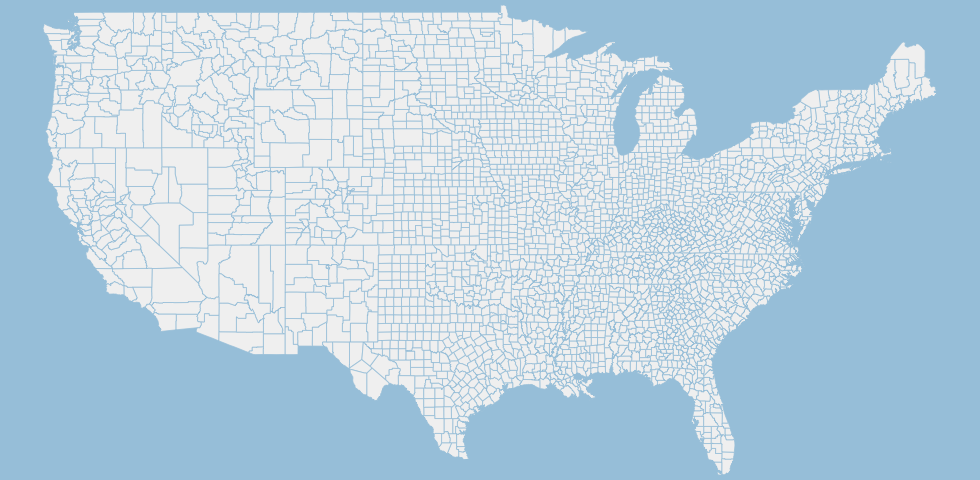
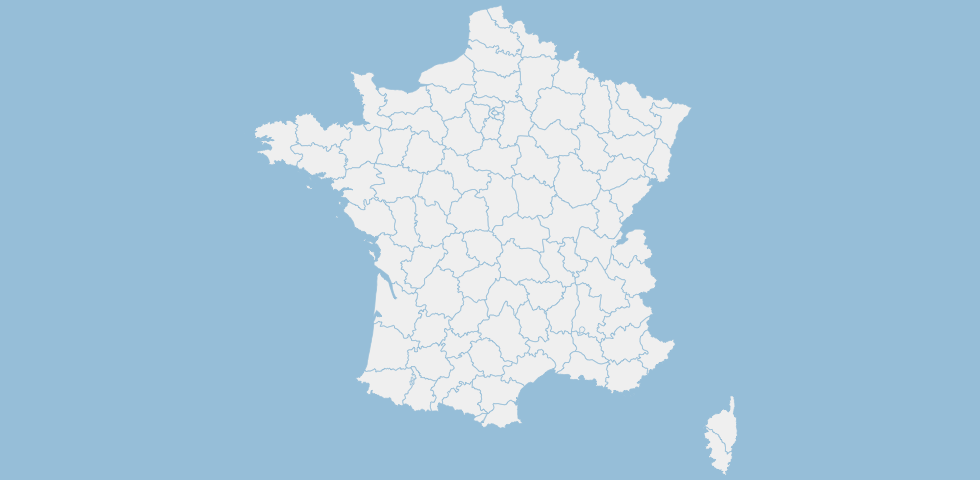
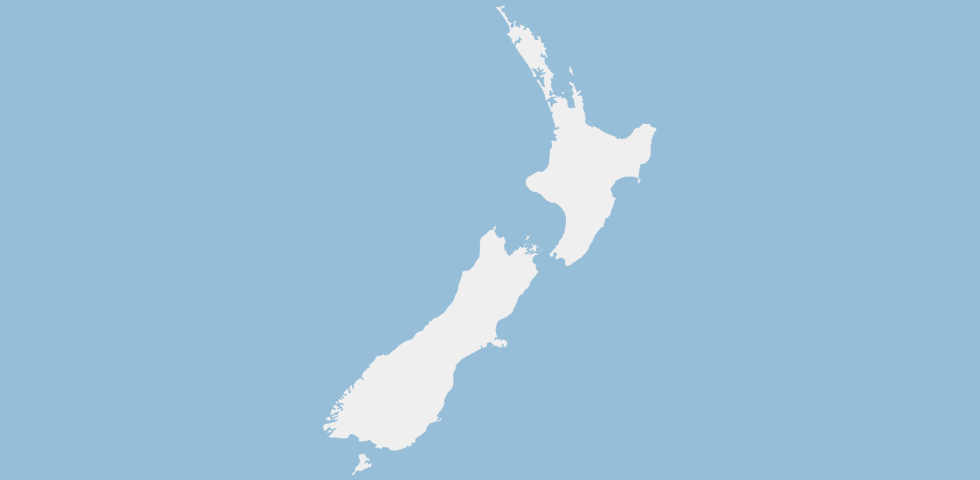
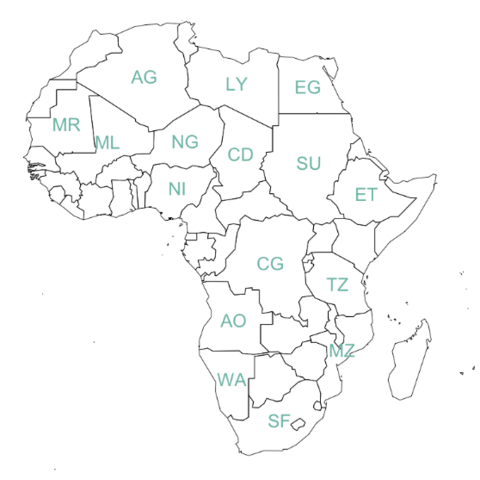
maps, mapdata and oz to get the most common boundariesA few libraries provide the most common spatial objects. It avoids the struggle to find the information somewhere on the web. Maps library: Canada, France, Italy, USA and its regions, world cities, NZ. Mapdata library (China, Japan, NZ, World in High resolution) and the oz library (Australia).
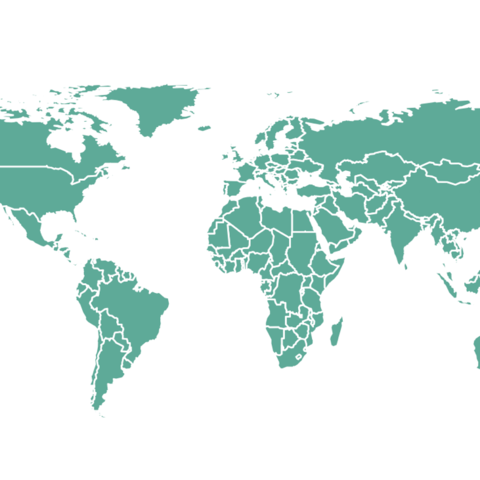
See all countries
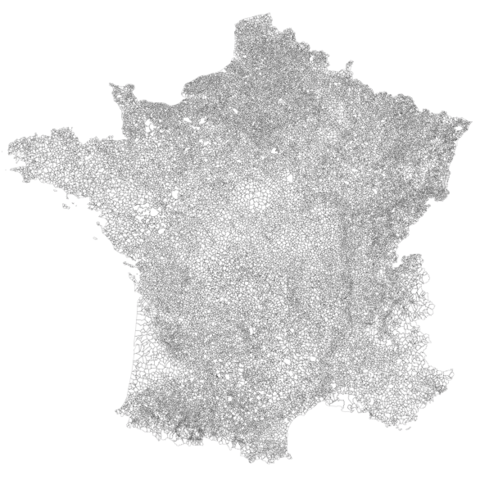
sf to read shapefiles and .geojson filesIf you are not satisfied with the previous options, you can search the web to find the spatial object you need.
This information will most likely be stored under one of these two following formats, and can
be read with the sf package:
- shape file, as described here.
- geojson file, as explained here.
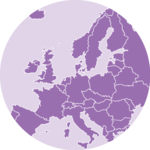
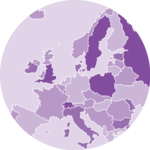
ggiraphggiraph is a package that makes super easy to create interactive charts, and map are not an exception.
The chart below automatically maps the countries from the map to the other charts with some nice hover effects thanks to CSS, which make it easy to understand and intuitive to interpret.
Try hovering over it!
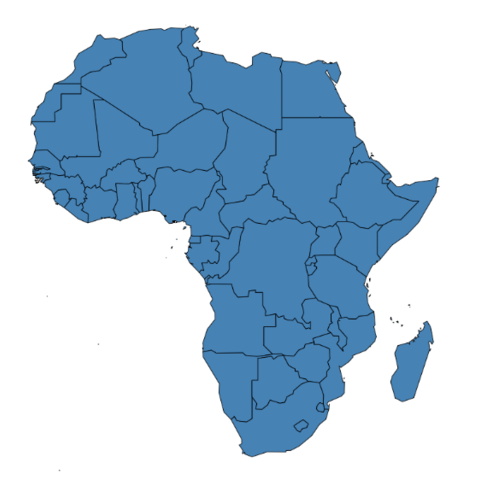
CodeOnce you've got your geospatial data loaded into R, you are ready to manipulate it. Examples below show how to select a region, how to simplfy the boundaries to get a lighter object, how to compute the region centroids and more.
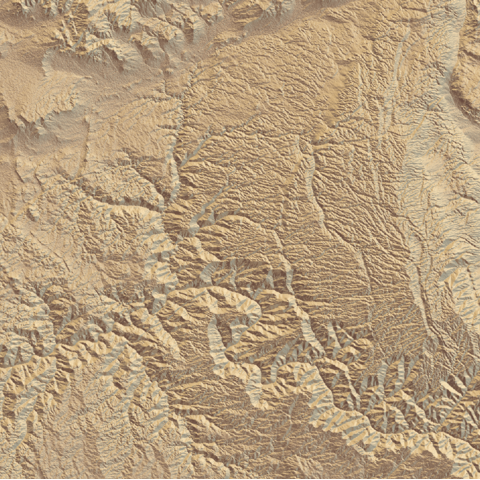
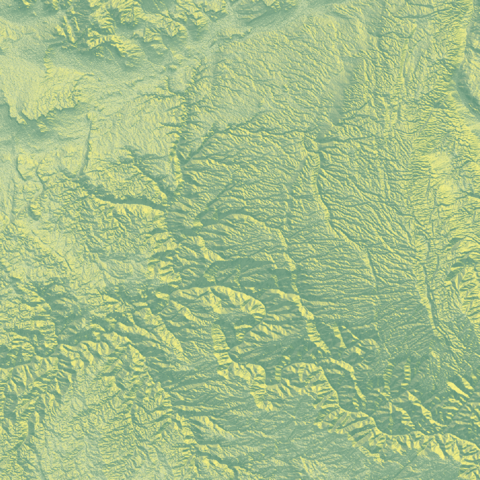
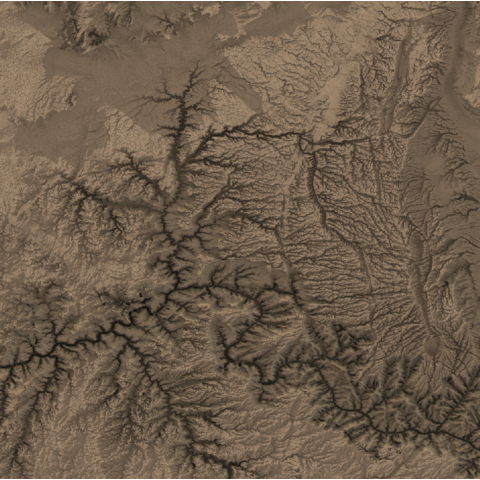
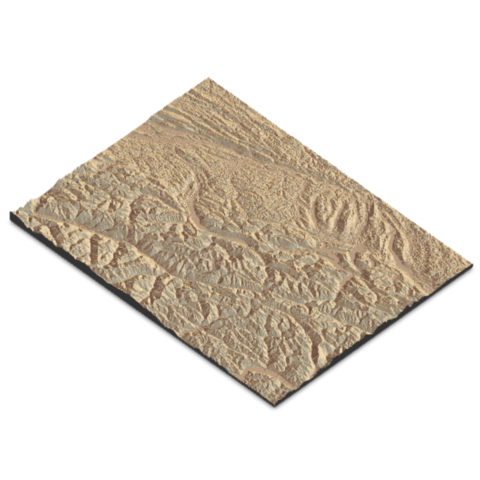
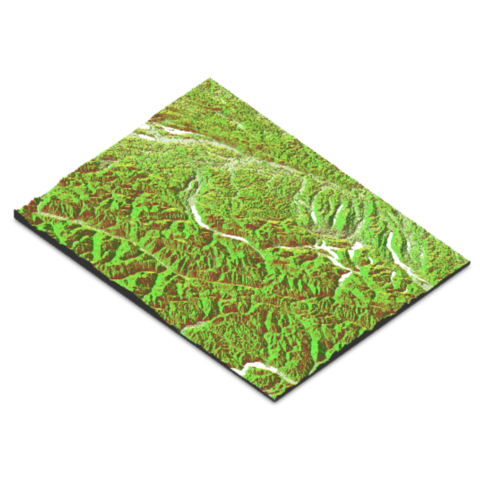
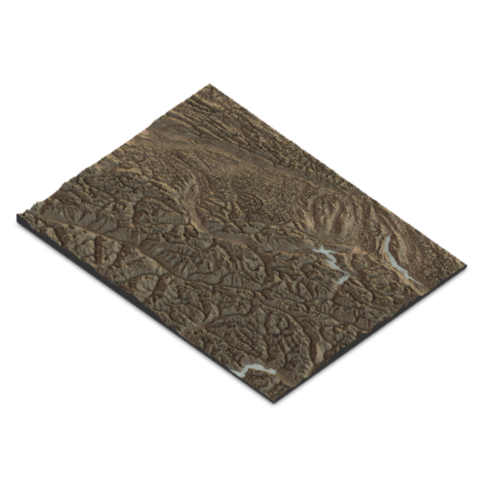
Rayshader for shaded mapsThe rayshader package is a great tool to create 2D and 3D maps with a shaded effect. It is particularly useful to create amazing maps with a relief effect. Click on an image to get the related code snippet.
The following tutorials will help you understand the basics of rayshader: