p-Hacking, Forking Paths and Preregistration
p-Hacking is trying many analyses on the same data and reporting only the one that dips below p = 0.05. The garden of forking paths is the quieter cousin, where even a single, good-faith analysis is shaped by the data and inflates false positives without any conscious fishing. Preregistration fixes both by writing your analysis plan down before you ever see the numbers.
What is p-hacking, and why does it break your p-value?
A p-value below 0.05 only means "1-in-20 by chance" when the test was decided before you looked at the data. The moment you run several analyses and keep the best-looking one, that 1-in-20 promise quietly stops holding. The cleanest way to believe this is to watch it happen on data with no real effect at all. Everything here uses base R, so you can run each block in your browser.
Let's start with an honest researcher. We compare two groups of pure random noise with a t-test, repeat that 10,000 times, and count how often the p-value falls below 0.05. Since there is no real difference, the answer should be about 5%.
The function draws 60 random values, splits them into two groups, and returns the t-test p-value. We repeat it 10,000 times and ask what fraction of those tests "found" a difference. The result, 0.0486, is almost exactly 5%. That is the false-positive rate working as advertised: run an honest test on noise, and about 1 in 20 will cross the line by luck.
Now let's p-hack. Imagine you measured five outcomes instead of one, say click-through, time-on-page, revenue, scroll depth, and returns. You run a test on each and report only the smallest p-value. Same noise, same null, but now you get five chances to get lucky.
Each study now generates five independent p-values, and we keep the minimum. Under the same pure-noise setup, the false-positive rate jumps from 5% to 0.2236, about 22%. Nothing about any single test changed. The p-values are still correct. What changed is the reporting rule: "show me the best of five" is a different question from "is this one test significant?"
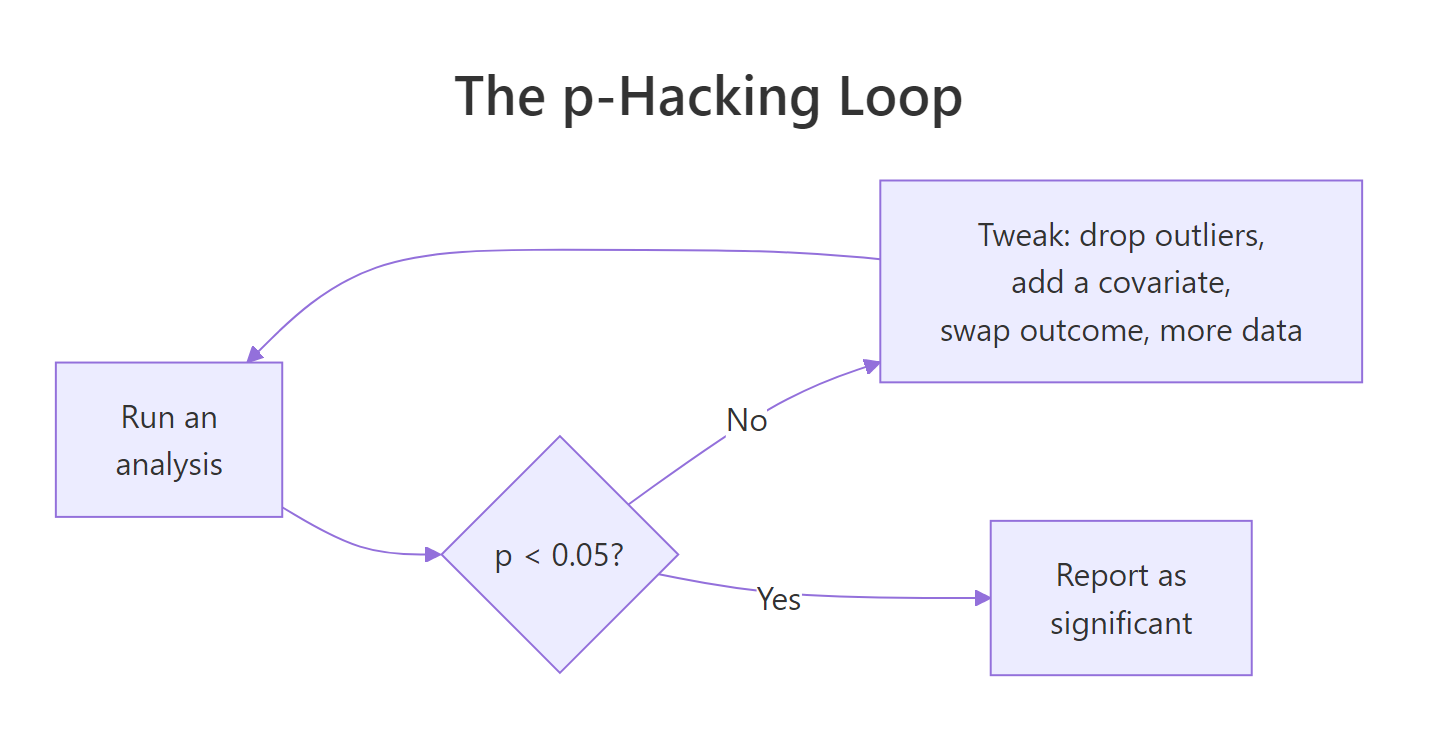
Figure 1: The p-hacking loop. Keep tweaking the analysis until the p-value cooperates, then report as if you ran one test.
There is a simple formula behind that jump. If you run m roughly independent tests, each with a 5% false-positive rate, the chance that at least one of them dips below 0.05 by luck is:
$$P(\text{at least one } p < 0.05) = 1 - (1 - \alpha)^m$$
Where:
- $\alpha$ = the per-test false-positive rate, here 0.05
- $m$ = the number of independent tests you tried
For five outcomes, that predicts $1 - 0.95^5 = 0.226$, which matches our simulated 0.2236 closely. If the math is not your thing, skip it: the simulation already told you the story. More tries means more false alarms.
Try it: Change the code to keep the smallest of ten outcomes instead of five. Predict the false-positive rate with the formula first, then check it by simulation.
Click to reveal solution
Explanation: With ten outcomes the false-positive rate climbs to about 41%, close to the formula's prediction of $1 - 0.95^{10} = 0.40$. Doubling the number of tries nearly doubled your odds of a false alarm.
What are researcher degrees of freedom?
The five-outcomes trick is one example of a broader problem. Every analysis involves small choices, and each choice you make after seeing the data is a chance to nudge the result. Simmons, Nelson and Simonsohn named these "researcher degrees of freedom" in their 2011 paper, and showed that just four common ones can push the false-positive rate above 60%.
Here are the four they studied, in plain terms:
- Choice of outcome. Measure several dependent variables and report whichever one worked (the trick you just simulated).
- Choice of sample size. Keep collecting data and stop the moment the result turns significant. This is called optional stopping.
- Choice of covariates. Add or drop control variables like age or gender until the key effect appears.
- Choice of conditions. Drop an experimental group or a subset of trials that muddies the picture.
Optional stopping is worth simulating because it feels so innocent. "I'll just collect a bit more data and check again" sounds responsible, but checking repeatedly and stopping at the first significant result is a powerful way to manufacture false positives. Here we start with 20 per group, test, and if it is not significant we add five more per group and test again, up to 100 per group.
The loop tests the data, and if the p-value is not yet below 0.05 it adds a few more observations and tests again, stopping as soon as it crosses the line. Both groups are pure noise, so a fair test should flag about 5%. Instead we get 0.1878, almost 19%. Peeking gave the noise many chances to cross 0.05, and roughly one time in five it eventually did.
Try it: Make the peeking even more aggressive by adding just two observations per group each step, up to a maximum of 40 per group. Does peeking more often make it better or worse?
Click to reveal solution
Explanation: Even with a smaller data budget (a maximum of 40 per group), peeking still lifts the false-positive rate to about 13%. The inflation comes from the repeated looks, not the sample size.
What is the garden of forking paths?
So far every example involved a researcher who consciously tried many things and cherry-picked. But here is the unsettling part: you can inflate your error rate without ever running more than one test. Andrew Gelman and Eric Loken called this "the garden of forking paths".
The idea is that your single analysis is not fixed in advance. It is contingent on the data. If the effect had shown up in men, you would have reported the male subgroup. If a value looked extreme, you would have dropped it as an outlier. You only walk one path, so you feel honest, but the path you take depends on what the data hands you. To measure your true error rate, you have to count every fork you could have taken.
Let's simulate a good-faith analyst. They correlate two unrelated variables, but their choice of which subgroup to report depends on the data. We count all the forks: the full sample, the "low" subgroup, and the "high" subgroup, and report the best-looking one.
For each study the analyst computes three correlations and reports the smallest p-value, because that is the one they would have found "interesting" enough to write up. The false-positive rate is 0.1092, about 11%, even though each finished paper contains exactly one reported test. The forks share data so they are correlated, which is why 11% sits below the fully-independent ceiling of $1 - 0.95^3 = 14\%$, but it is still more than double the 5% you were promised.
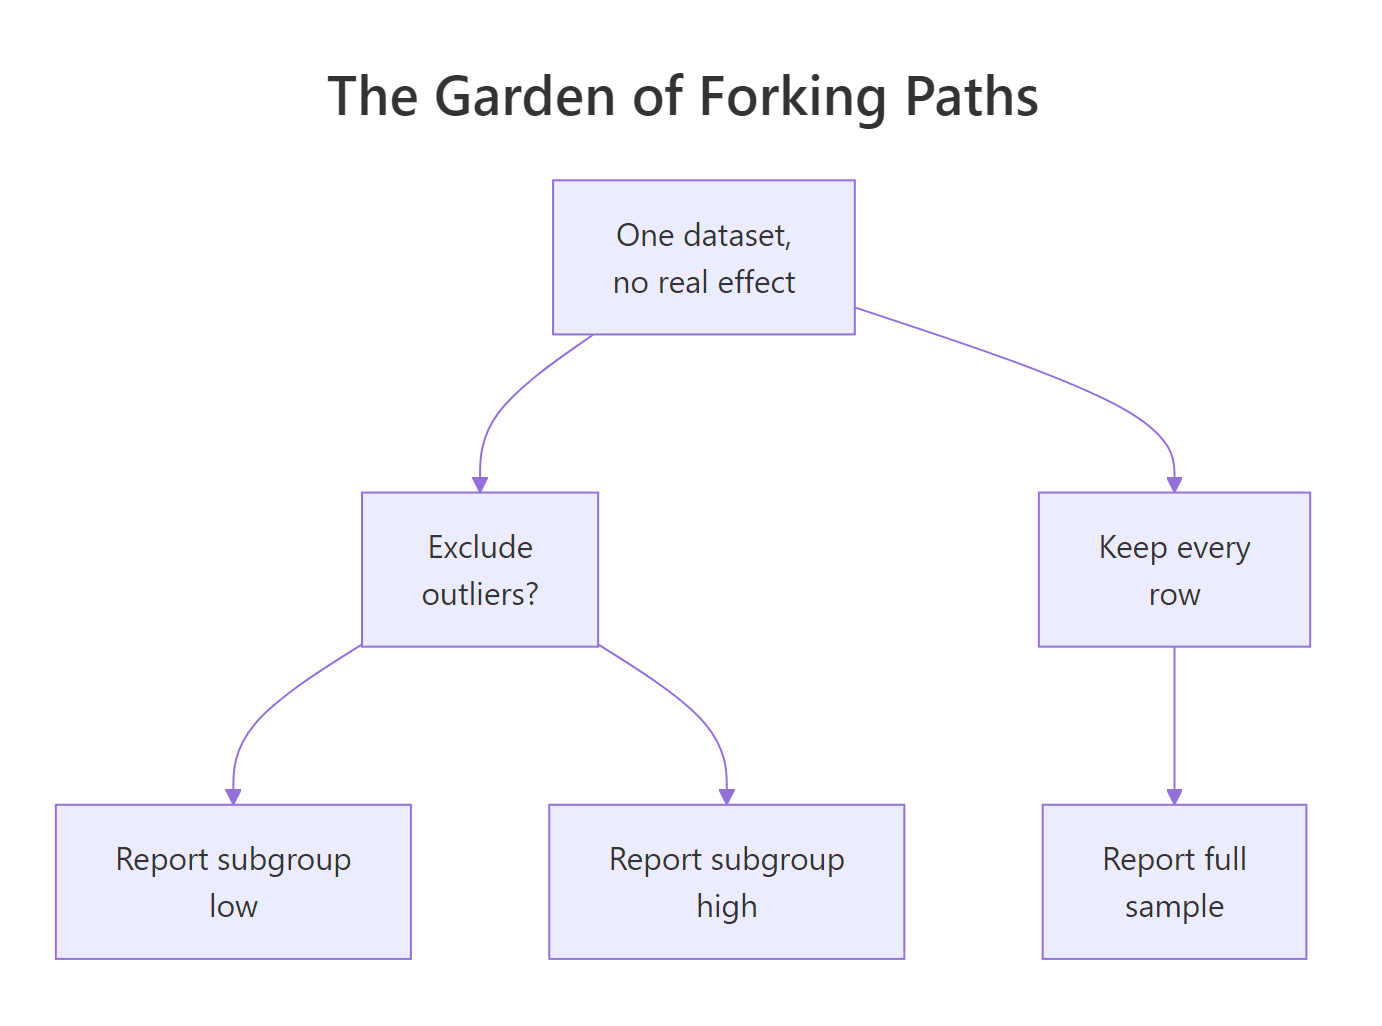
Figure 2: The garden of forking paths. One dataset supports many analyses you could have run, and reporting only the branch that worked inflates the error rate.
This is the deep difference between the two problems. p-Hacking is a behavior you can choose to stop. The garden of forking paths is a structure that traps even careful, well-meaning researchers, which is exactly why good intentions are not enough.
Try it: Add a fourth fork to the analysis, a "remove the most extreme value" path, and report the minimum p-value across all four. The scaffold below already sets up the data.
Click to reveal solution
Explanation: Adding one more defensible-sounding choice pushes the false-positive rate to about 13%. Each extra fork you would have been willing to walk down adds more room for noise to look like signal.
How does preregistration stop p-hacking?
If the problem is that your analysis choices depend on the data, the fix is to make those choices before the data exists. That is preregistration: you write down your hypothesis and your exact analysis plan, timestamp it in a public registry, and then collect your data. There are no forks left to walk because you already committed to a single path.
Watch what happens to the exact same forking scenario when the analysis is fixed in advance. The data-generating process is identical to the previous section, but now the analyst pre-specified one test on the full sample, with no subgroup fishing.
Same noise, same variables, but only one pre-committed test per study. The false-positive rate is 0.0513, right back at the nominal 5%. Preregistration did not change your data or your statistics. It removed the flexibility that was inflating your error rate in the first place.
A useful preregistration pins down every choice that could otherwise become a fork:
- The hypothesis and its direction. What effect do you predict, and which way?
- Sample size and stopping rule. How many observations, decided before you start, with no peeking.
- Exclusion criteria. Exactly which data points you will drop, and the rule for doing so.
- The primary outcome. The one measure that decides the question, chosen up front.
- The model and covariates. The exact test or model, including which controls go in.
- Any transformations. Logs, standardization, or trimming, specified in advance.
Preregistration does not ban curiosity. It separates two kinds of work that were tangled together. A confirmatory analysis tests a prediction you committed to in advance, and its p-value means what it says. An exploratory analysis goes looking for patterns after the fact, which is a wonderful way to generate new hypotheses, as long as you label it honestly and test those hypotheses on fresh data later.
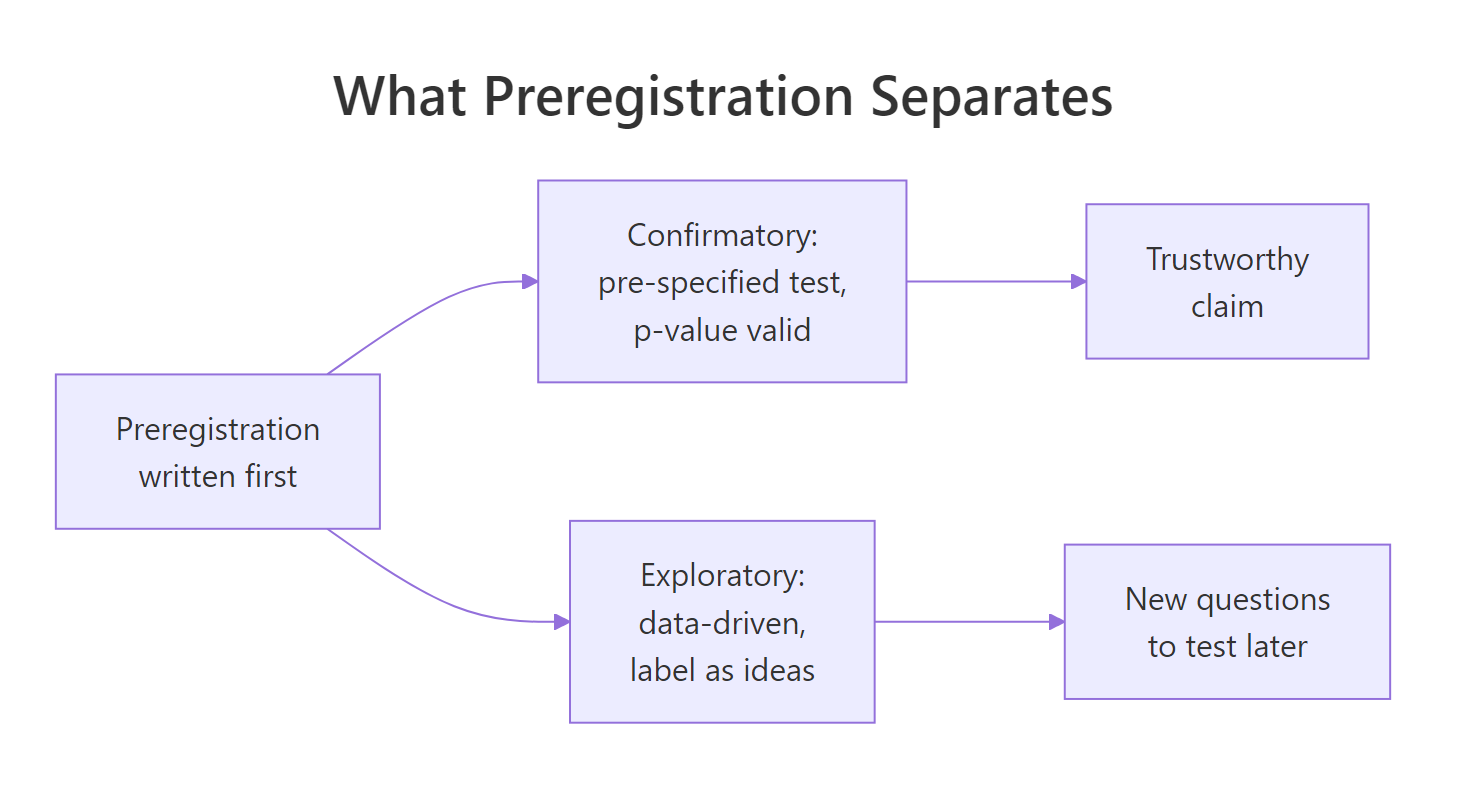
Figure 3: Preregistration separates confirmatory tests, whose p-values are valid, from exploratory analysis, which generates ideas to test later.
You can preregister for free in a few places. The Open Science Framework (OSF) hosts time-stamped registrations, AsPredicted asks nine short questions and is popular for quick studies, and a Registered Report goes further by sending your plan through peer review before data collection so the journal commits to publishing the result whichever way it turns out.
Try it: Preregistration is not only about avoiding subgroups. Pre-specify a covariate-adjusted model, lm(y ~ x + z), and confirm it also holds the false-positive rate near 5%.
Click to reveal solution
Explanation: A single pre-specified model, even one with a covariate, holds the false-positive rate near 5%. What inflates error is choosing the covariate after seeing the data, not the covariate itself.
What if you still need to explore the data?
Sometimes you genuinely cannot pre-specify everything. Which outliers count as errors, whether to log-transform, which covariates matter: these choices are debatable and data-dependent by nature. Hiding that uncertainty by reporting one path is p-hacking. The honest alternative is a multiverse analysis: run every reasonable version of the analysis and report the whole spread of results, so your reader can see how fragile or robust the finding is.
Here we take a dataset with a small, genuine effect and vary two defensible choices: whether to trim extreme outliers, and whether to adjust for age. That gives a small "multiverse" of four analyses.
Each row is one defensible analysis and its p-value for the treatment effect. In the code, scale() rescales outcome into standard-deviation units, so abs(scale(outcome)) < 2.5 keeps only the points within 2.5 standard deviations of the mean. Look closely: with no trimming the effect is significant (p around 0.033), but trimming outliers at 2.5 standard deviations pushes it just over 0.05 (p around 0.055). The finding sits right at the boundary of the outlier rule. A p-hacker would report only row 1 and call it a discovery. A multiverse analysis reports all four rows and lets you say, honestly, that the effect is real but fragile.
Try it: Add a third, looser exclusion rule, trim3SD, so the multiverse has six paths, then count how many of them are significant.
Click to reveal solution
Explanation: Four of the six paths are significant. The looser 3 SD trim keeps more data and recovers significance, so whether you call the result "significant" depends on a choice most readers would never see. Reporting all six is what makes the analysis honest.
Complete Example: From p-Hacking to a Preregistered A/B Test
Let's tie everything together with a story you might actually live through. You run an A/B test on a website. There is no real difference between the control and the treatment: both convert at 20%. The overall test will say so. But you are under pressure to find a "win", so you start slicing the results by device, browser, and country, testing every segment for a difference.
The overall test returns p = 0.788, correctly reporting no difference. But once we split the users into 18 device-by-browser-by-country segments and keep the best one, we find a slice (desktop, Safari, UK) with p = 0.017. Framed as "Safari users on desktop in the UK converted significantly better", that looks like a real, shippable finding. It is pure noise, dressed up by 18 chances to get lucky.
Now here is the same test run the preregistered way. Before the experiment launched, you wrote down a plan: the primary metric is the overall conversion rate, tested once with a two-proportion test at alpha = 0.05. Segment breakdowns are allowed, but they are labelled exploratory and would need their own confirmatory test later.
The preregistered analysis reports p = 0.788 and honestly concludes there was no lift. The Safari-desktop-UK pattern is not thrown away; it becomes a hypothesis you can test in the next experiment. Same data, same code, but one workflow ships a false positive and the other tells the truth.
Practice Exercises
These combine several ideas from the tutorial. Each uses its own variable names so it will not clash with the code above.
Exercise 1: Measure the cost of one extra outcome
Compare an honest analyst to a mild p-hacker in a single run. The honest analyst runs one t-test on 25-per-group noise. The hacker measures three outcomes and keeps the smallest p-value. Estimate both false-positive rates over 5,000 simulations and report them together.
Click to reveal solution
Explanation: The honest rate sits at the expected 5%, while keeping the best of three outcomes nearly triples it to about 14%. Even a "small" amount of flexibility has a large, measurable cost.
Exercise 2: Stack two degrees of freedom
Real p-hacking rarely uses just one trick. Write a function that combines optional stopping with multiple outcomes: track two outcomes, peek after every batch of 10 new observations per group (starting at 20, up to 60), and declare success if either outcome ever crosses 0.05. Estimate the false-positive rate over 3,000 simulations.
Click to reveal solution
Explanation: Combining two flexibilities pushes the false-positive rate to about 23%, higher than either trick alone. Researcher degrees of freedom stack, which is how honest-looking studies reach the 60%-plus rates in the literature.
Exercise 3: Preregister the sample size
Show that fixing the plan in advance repairs the damage from Exercise 2's peeking. Write a function that draws a fixed 60 observations per group, decided before any data is seen, runs the t-test exactly once, and returns whether p is below 0.05. Estimate the rate over 5,000 simulations.
Click to reveal solution
Explanation: With the sample size preregistered and a single test, the false-positive rate falls back to 5%. The cure for optional stopping is not a fancier statistic, it is committing to your n before you look.
Summary
p-Hacking, the garden of forking paths, and preregistration are three views of one idea: a p-value is only trustworthy when the analysis that produced it was chosen independently of the data. The mindmap below recaps how the pieces fit.
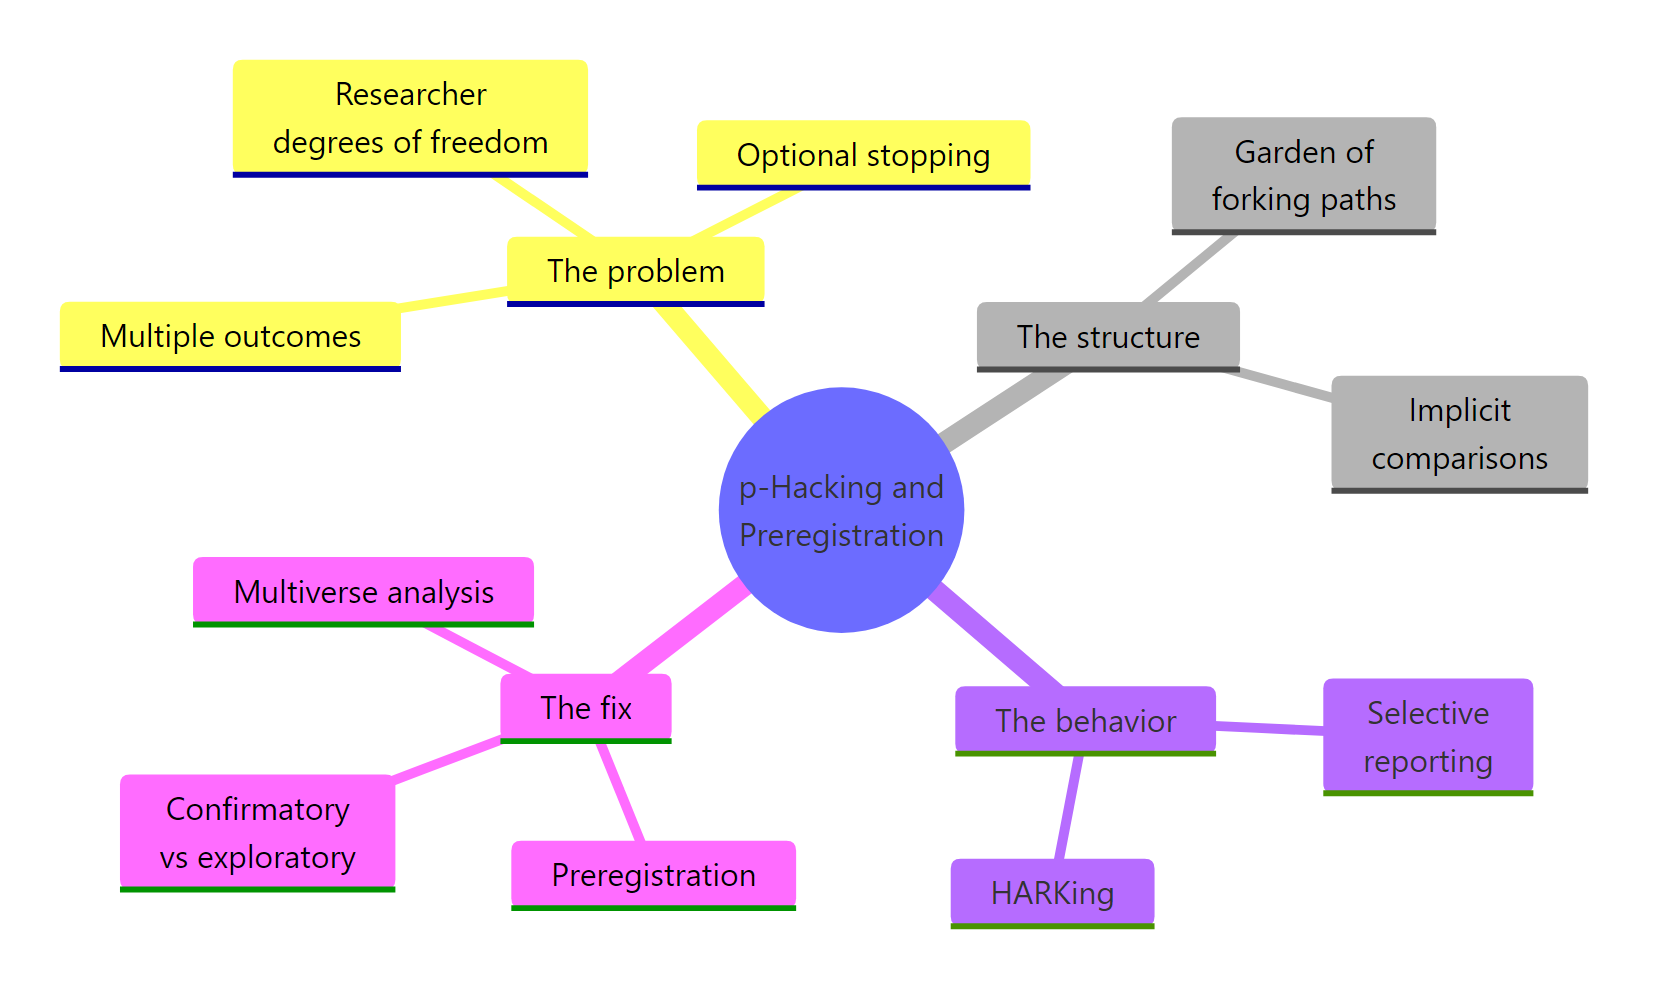
Figure 4: The problem (researcher degrees of freedom), the structure (forking paths), the behavior (selective reporting), and the fix (preregistration).
Here are the takeaways worth keeping:
| Concept | What it is | Why it inflates error | The fix |
|---|---|---|---|
| p-Hacking | Trying many analyses, reporting the best | Many chances to cross 0.05 by luck | Pre-specify one analysis |
| Researcher degrees of freedom | Flexible choices in outcomes, sample size, covariates, conditions | Each post-hoc choice is a hidden test | Decide every choice up front |
| Garden of forking paths | Data-dependent choices in a single analysis | Implicit multiple comparisons, even in good faith | Preregistration removes the forks |
| Optional stopping | Collecting data until significant | Every peek is another chance | Fix the sample size in advance |
| Multiverse analysis | Running every reasonable version | Only a problem if you cherry-pick | Report the full spread, not one cell |
The habit is simple to state and hard to keep: separate confirmatory work, which tests a plan you committed to, from exploratory work, which generates the plans you will test next. When you cannot pre-specify a choice, run the multiverse and show the reader every branch. Your future self, and everyone who tries to build on your result, will thank you.
Frequently Asked Questions
Is p-hacking the same as fraud?
No. Fraud means fabricating or falsifying data on purpose. Most p-hacking is done by honest researchers who believe each individual choice they make is reasonable. That is what makes it so common and so hard to catch. The data are real; only the reporting rule is biased.
How is the garden of forking paths different from p-hacking?
p-Hacking is a behavior: you consciously try several analyses and keep the best one. The garden of forking paths is a structure: even if you run a single analysis, your choice of that analysis was shaped by the data you saw. You do not need to fish deliberately to inflate your error rate, so the forking paths trap even careful people.
Does preregistration mean I cannot explore my data?
Not at all. Preregistration does not forbid exploration; it labels it. Anything you planned in advance is confirmatory, and its p-value is valid. Anything you discover after looking is exploratory, which is a great source of new hypotheses you can confirm in a later study on fresh data.
Can I preregister after I have already collected the data?
Only if you have not looked at it in a way that could bias your plan. The whole point is that your analysis choices are independent of the outcomes. If the data already shaped your thinking, a "preregistration" written afterward does not remove the forks. In that situation, be transparent and run a multiverse analysis instead.
How is this different from correcting for multiple comparisons?
Multiple-comparison corrections like Bonferroni assume you can count every test you ran. p-Hacking and forking paths are harder because the extra tests are hidden or hypothetical, so there is no clean count to correct. Preregistration prevents the hidden tests from happening at all. See Multiple Testing in R for the correction math when the count is known.
References
- Simmons, J. P., Nelson, L. D., & Simonsohn, U. (2011). False-Positive Psychology: Undisclosed Flexibility in Data Collection and Analysis Allows Presenting Anything as Significant. Psychological Science, 22(11). Link
- Gelman, A., & Loken, E. (2013). The Garden of Forking Paths: Why Multiple Comparisons Can Be a Problem, Even When There Is No "Fishing Expedition". Link
- Steegen, S., Tuerlinckx, F., Gelman, A., & Vanpaemel, W. (2016). Increasing Transparency Through a Multiverse Analysis. Perspectives on Psychological Science, 11(5). Link
- Head, M. L., Holman, L., Lanfear, R., Kahn, A. T., & Jennions, M. D. (2015). The Extent and Consequences of P-Hacking in Science. PLOS Biology, 13(3). Link
- Nosek, B. A., et al. (2018). The Preregistration Revolution. PNAS, 115(11). Link
- Center for Open Science. Preregistration on the Open Science Framework (OSF). Link
- R Core Team. t.test and cor.test, base stats package documentation. Link
Continue Learning
- What p-Values Mean (and What They Never Meant) - build the p-value from scratch by simulation, so the false-positive logic here feels obvious.
- Multiple Testing in R - when you deliberately run many tests, correct them with Bonferroni and Benjamini-Hochberg FDR.
- R and the Reproducibility Crisis - five R habits, from seeds to pre-specified plans, that make your analysis verifiable.