Chapter 12 ggtree utilities
12.1 facet utilities
12.1.1 facet_widths
library(ggplot2)
library(ggstance)
library(ggtree)
library(reshape2)

set.seed(123)
tree <- rtree(30)

p <- ggtree(tree, branch.length = "none") +
    geom_tiplab() + theme(legend.position='none')

a <- runif(30, 0,1)
b <- 1 - a
df <- data.frame(tree$tip.label, a, b)
df <- melt(df, id = "tree.tip.label")

p2 <- facet_plot(p + xlim_tree(8), panel = 'bar', data = df, geom = geom_barh,
                 mapping = aes(x = value, fill = as.factor(variable)),
                 width = 0.8, stat='identity') + xlim_tree(9)

facet_widths(p2, widths = c(1, 2))
It also supports using name vector to set the widths of specific panels. The following code will display identical figure to Figure 12.1A.
facet_widths(p2, c(Tree = .5))The facet_widths function also work with other ggplot object as demonstrated in Figure 12.1B.
p <- ggplot(iris, aes(Sepal.Width, Petal.Length)) +
  geom_point() + facet_grid(.~Species)
facet_widths(p, c(setosa = .5))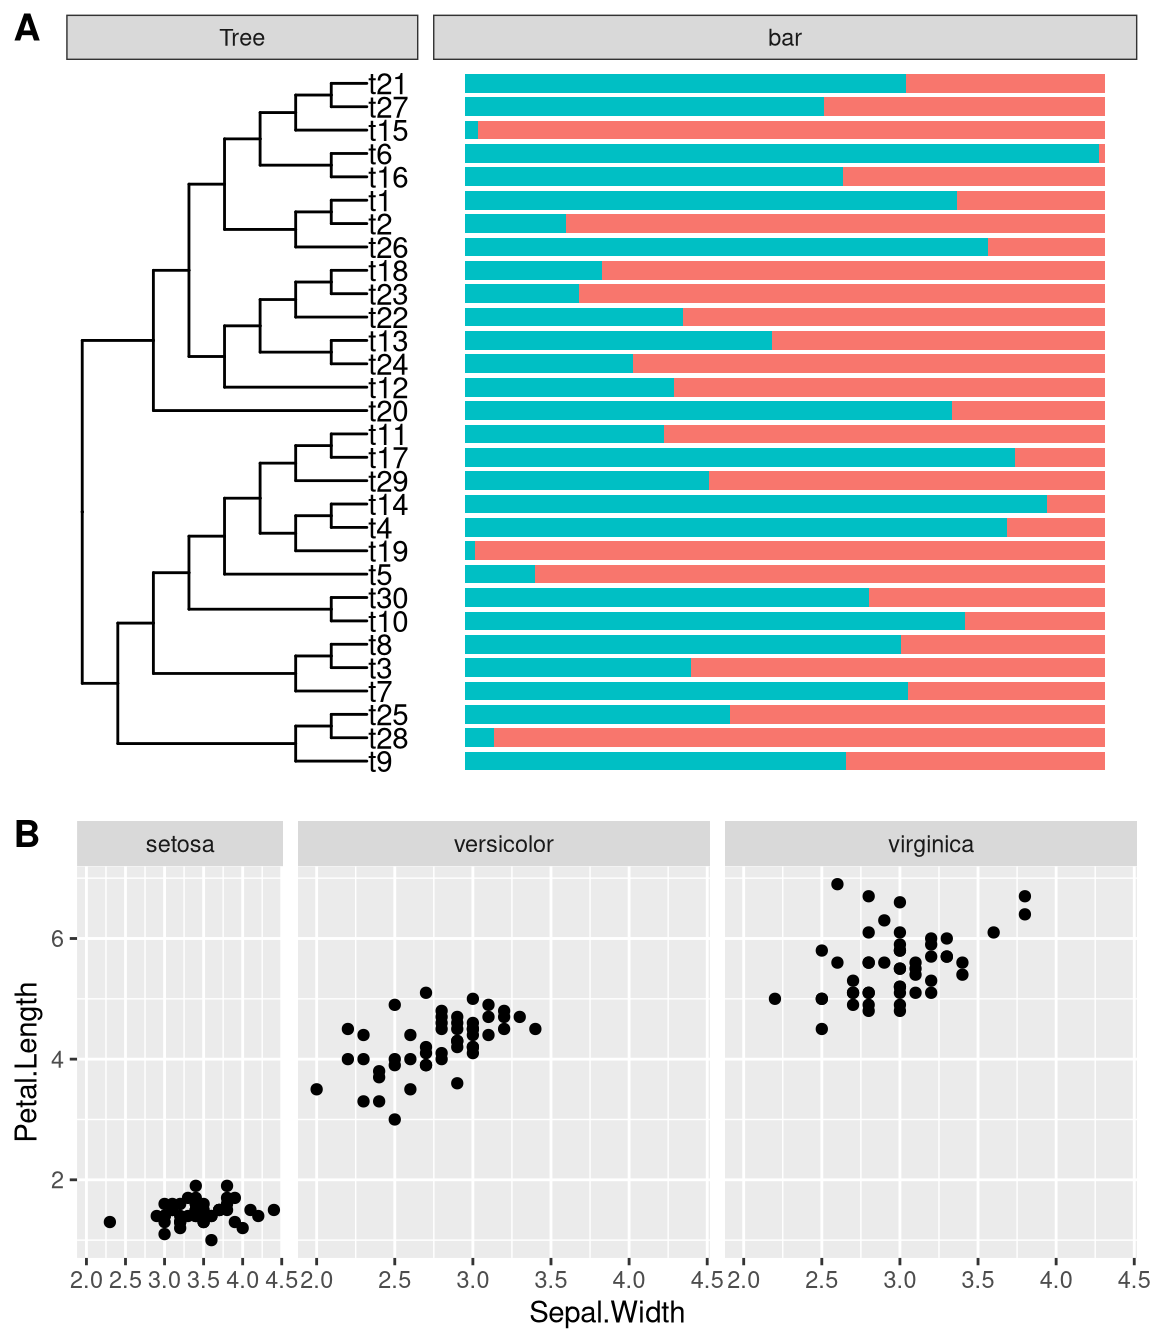
Figure 12.1: Adjust relative widths of ggplot facets. The facet_widths function works with ggtree (A) as well as ggplot (B).
12.1.2 facet_labeller
The facet_labeller function was designed to re-label selected panels, and it currently only works with ggtree object (i.e. facet_plot output).
facet_labeller(p2, c(Tree = "phylogeny", bar = "HELLO"))If you want to combine facet_widths with facet_labeller, you need to call facet_labeller to re-label the panels before using facet_widths to set the relative widths of each panels. Otherwise it wont work since the output of facet_widths is re-drawn from grid object.
facet_labeller(p2, c(Tree = "phylogeny")) %>% facet_widths(c(Tree = .4))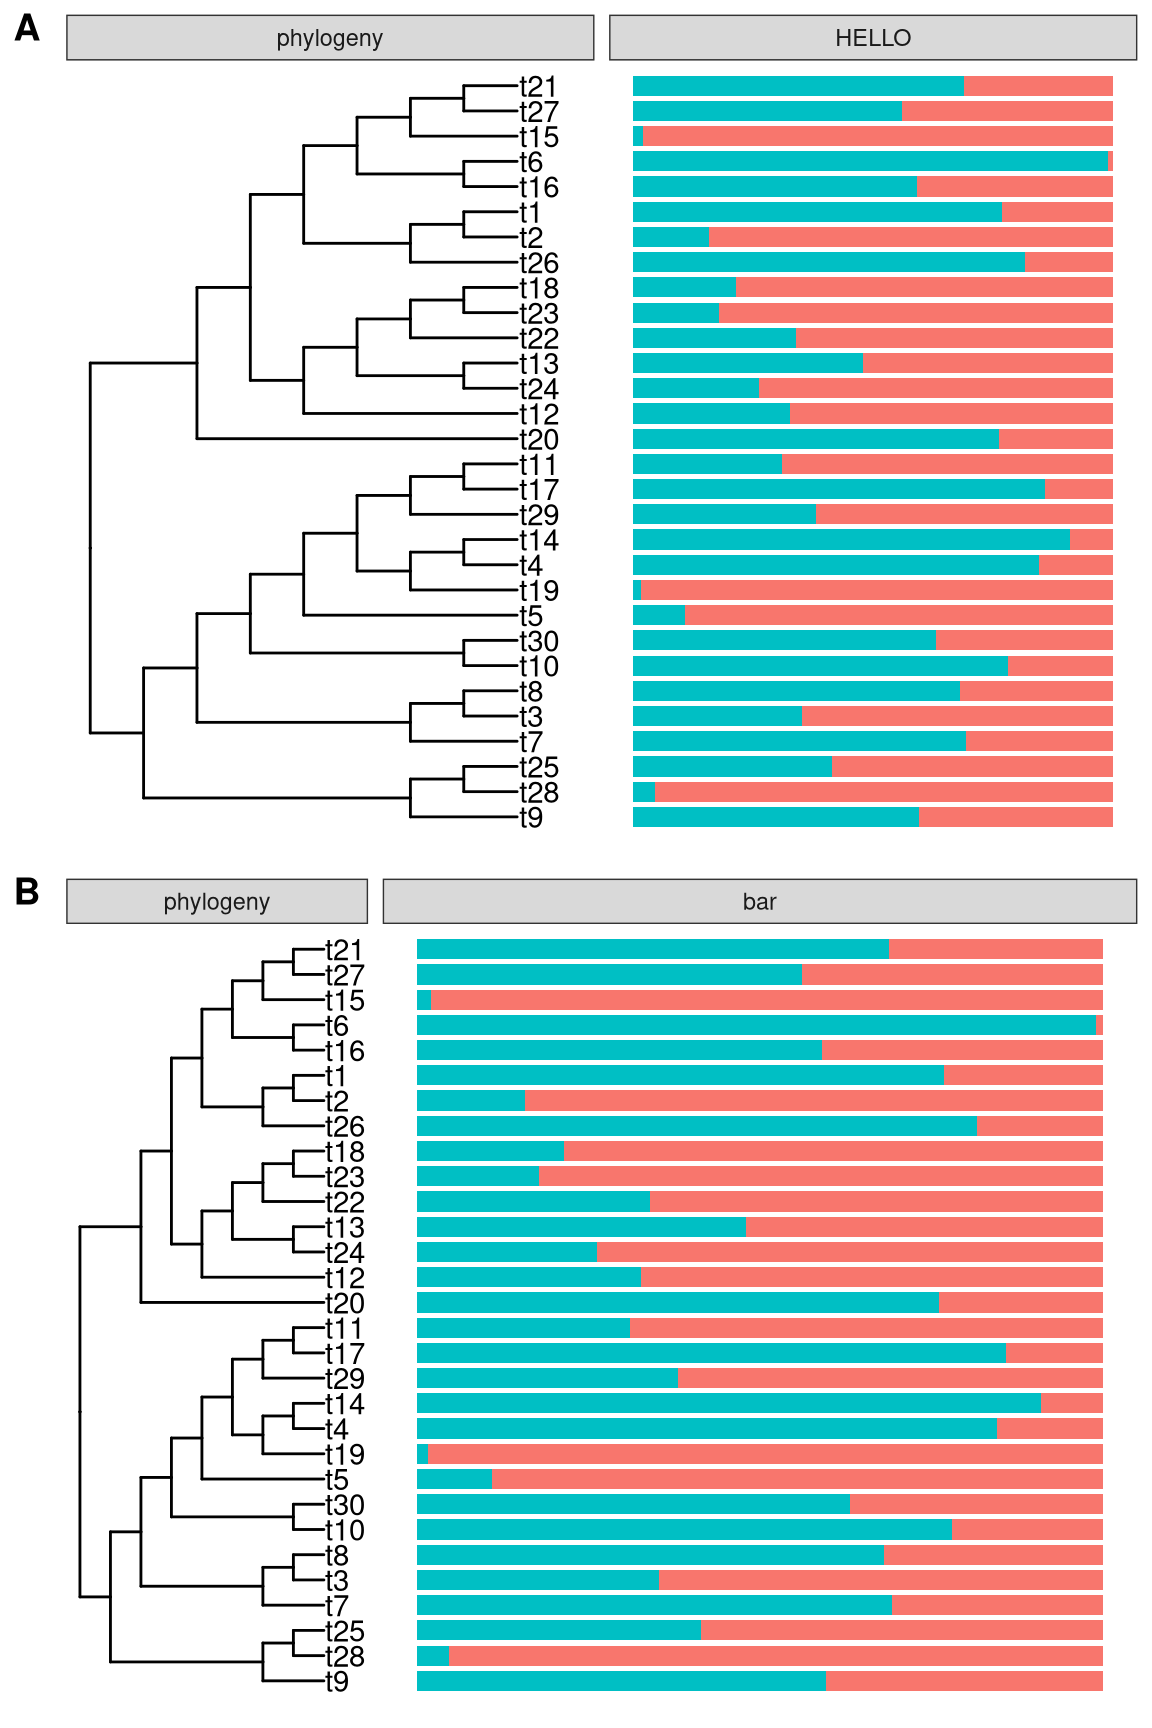
Figure 12.2: Rename facet labels. Rename multiple labels simultaneously (A) or only for specific one (B) are all supported. facet_labeller can combine with facet_widths to rename facet label and then adjust relative widths (B).
12.2 Geometric layers
Subsetting is not supported in layers defined in ggplot2, while it is quite useful in phylogenetic annotation since it allows us to annotate at specific node(s) (e.g. only label bootstrap values that larger than 75).
In ggtree, we provides modified version of layers defined in ggplot2 to support aesthetic mapping of subset, including:
- geom_segment2
- geom_point2
- geom_text2
- geom_label2
library(ggplot2)
library(ggtree)
data(mpg)
p <- ggplot(data = mpg, mapping = aes(x = displ, y = hwy)) +
   geom_point(mapping = aes(color = class)) +
   geom_text2(aes(label=manufacturer,
                  subset = hwy > 40 | displ > 6.5),
                  nudge_y = 1) +
   coord_cartesian(clip = "off") +
   theme_light() +
   theme(legend.position = c(.85, .75))

p2 <- ggtree(rtree(10)) +
    geom_label2(aes(subset = node <5, label = label))
plot_grid(p, p2, ncol=2, labels=c("A", "B"))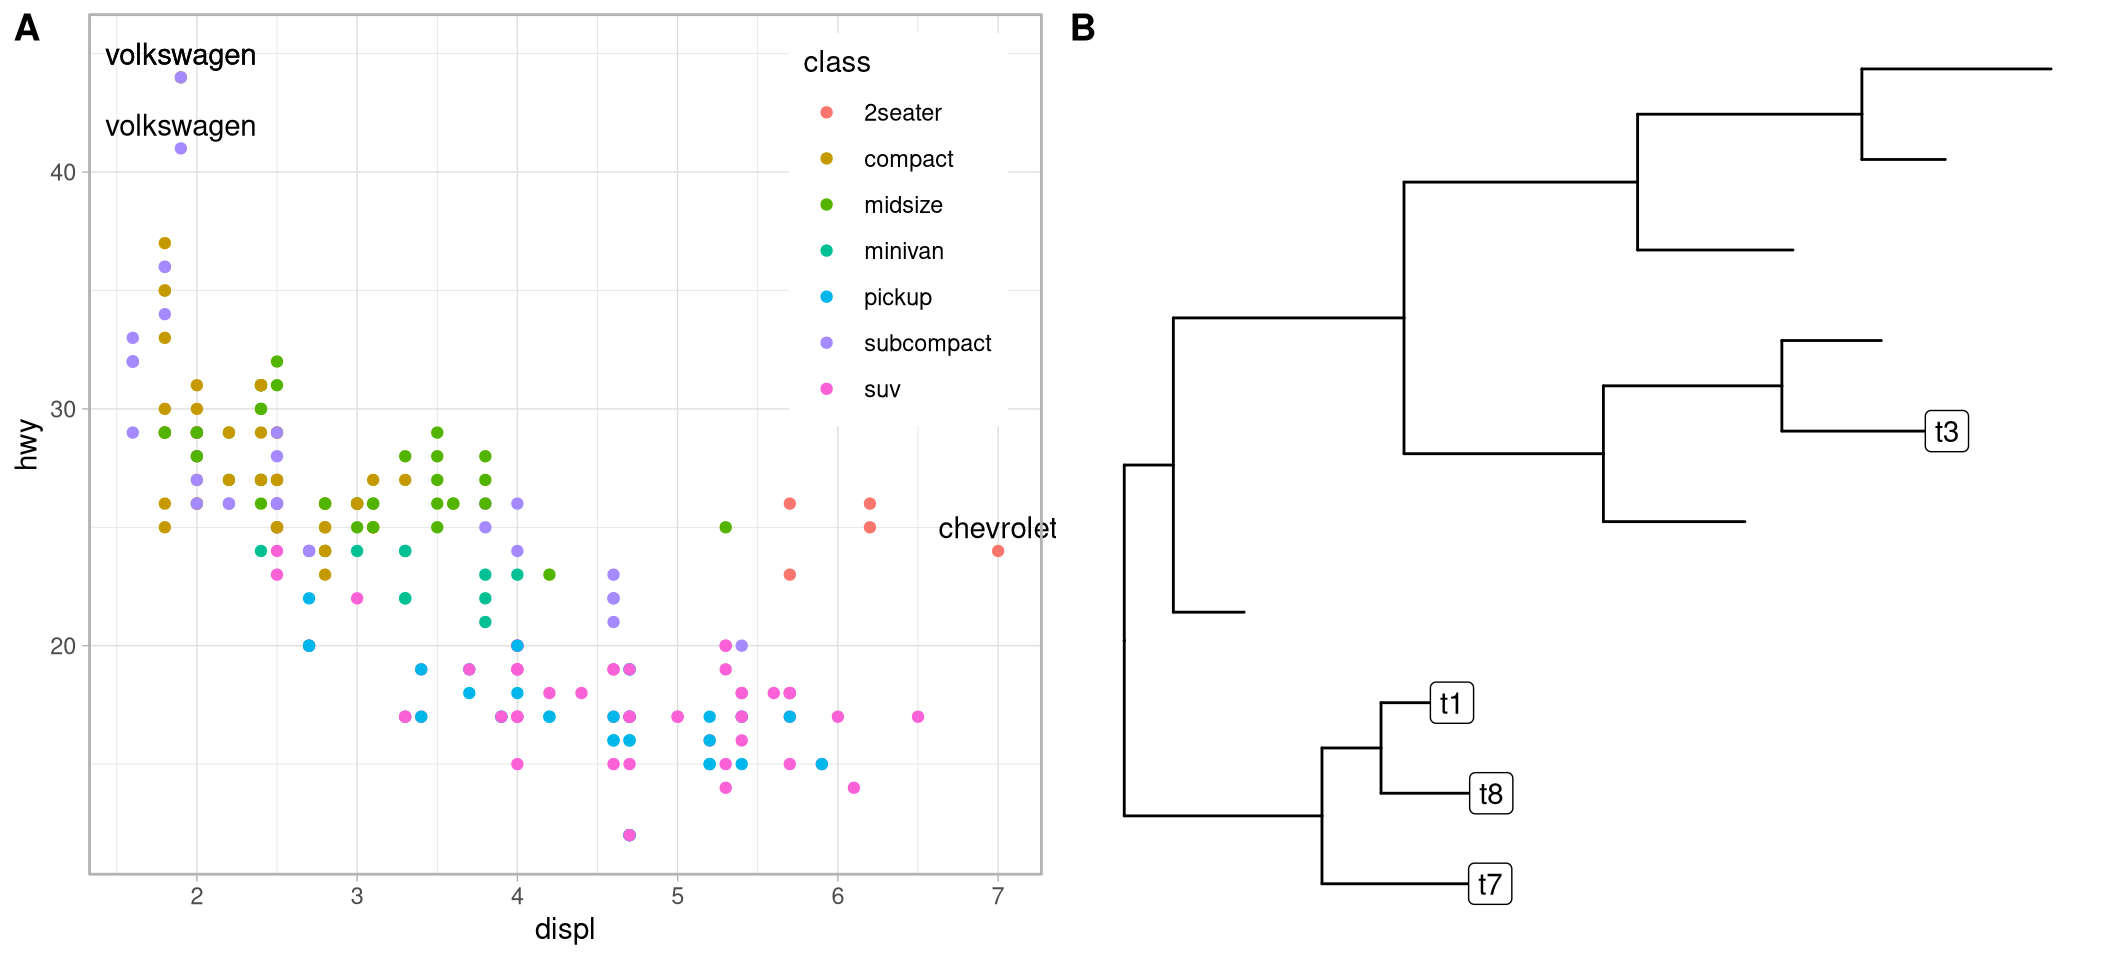
Figure 12.3: Geometric layers that supports subsetting. Thes layers works with ggplot2 (A) and ggtree (B).
12.3 Layout utilities
In session 4.2.2, we introduce several layouts that supported by ggtree. The ggtree package also provide several layout functions that can transform from one to another. Note that not all layouts are supported (see 12.1).
| Layout | Description |
|---|---|
| layout_circular | transform rectangular layout to circular layout |
| layout_dendrogram | transform rectangular layout to dendrogram layout |
| layout_fan | transform rectangular/circular layout to fan layout |
| layout_rectangular | transform circular/fan layout to rectangular layout |
| layout_inward_circular | transform rectangular/circular layout to inward_circular layout |
set.seed(2019)
x <- rtree(20)
p <- ggtree(x)
p + layout_dendrogram()
ggtree(x, layout = "circular") + layout_rectangular()
p + layout_circular()
p + layout_fan(angle=90)
p + layout_inward_circular(xlim=4) + geom_tiplab(hjust=1)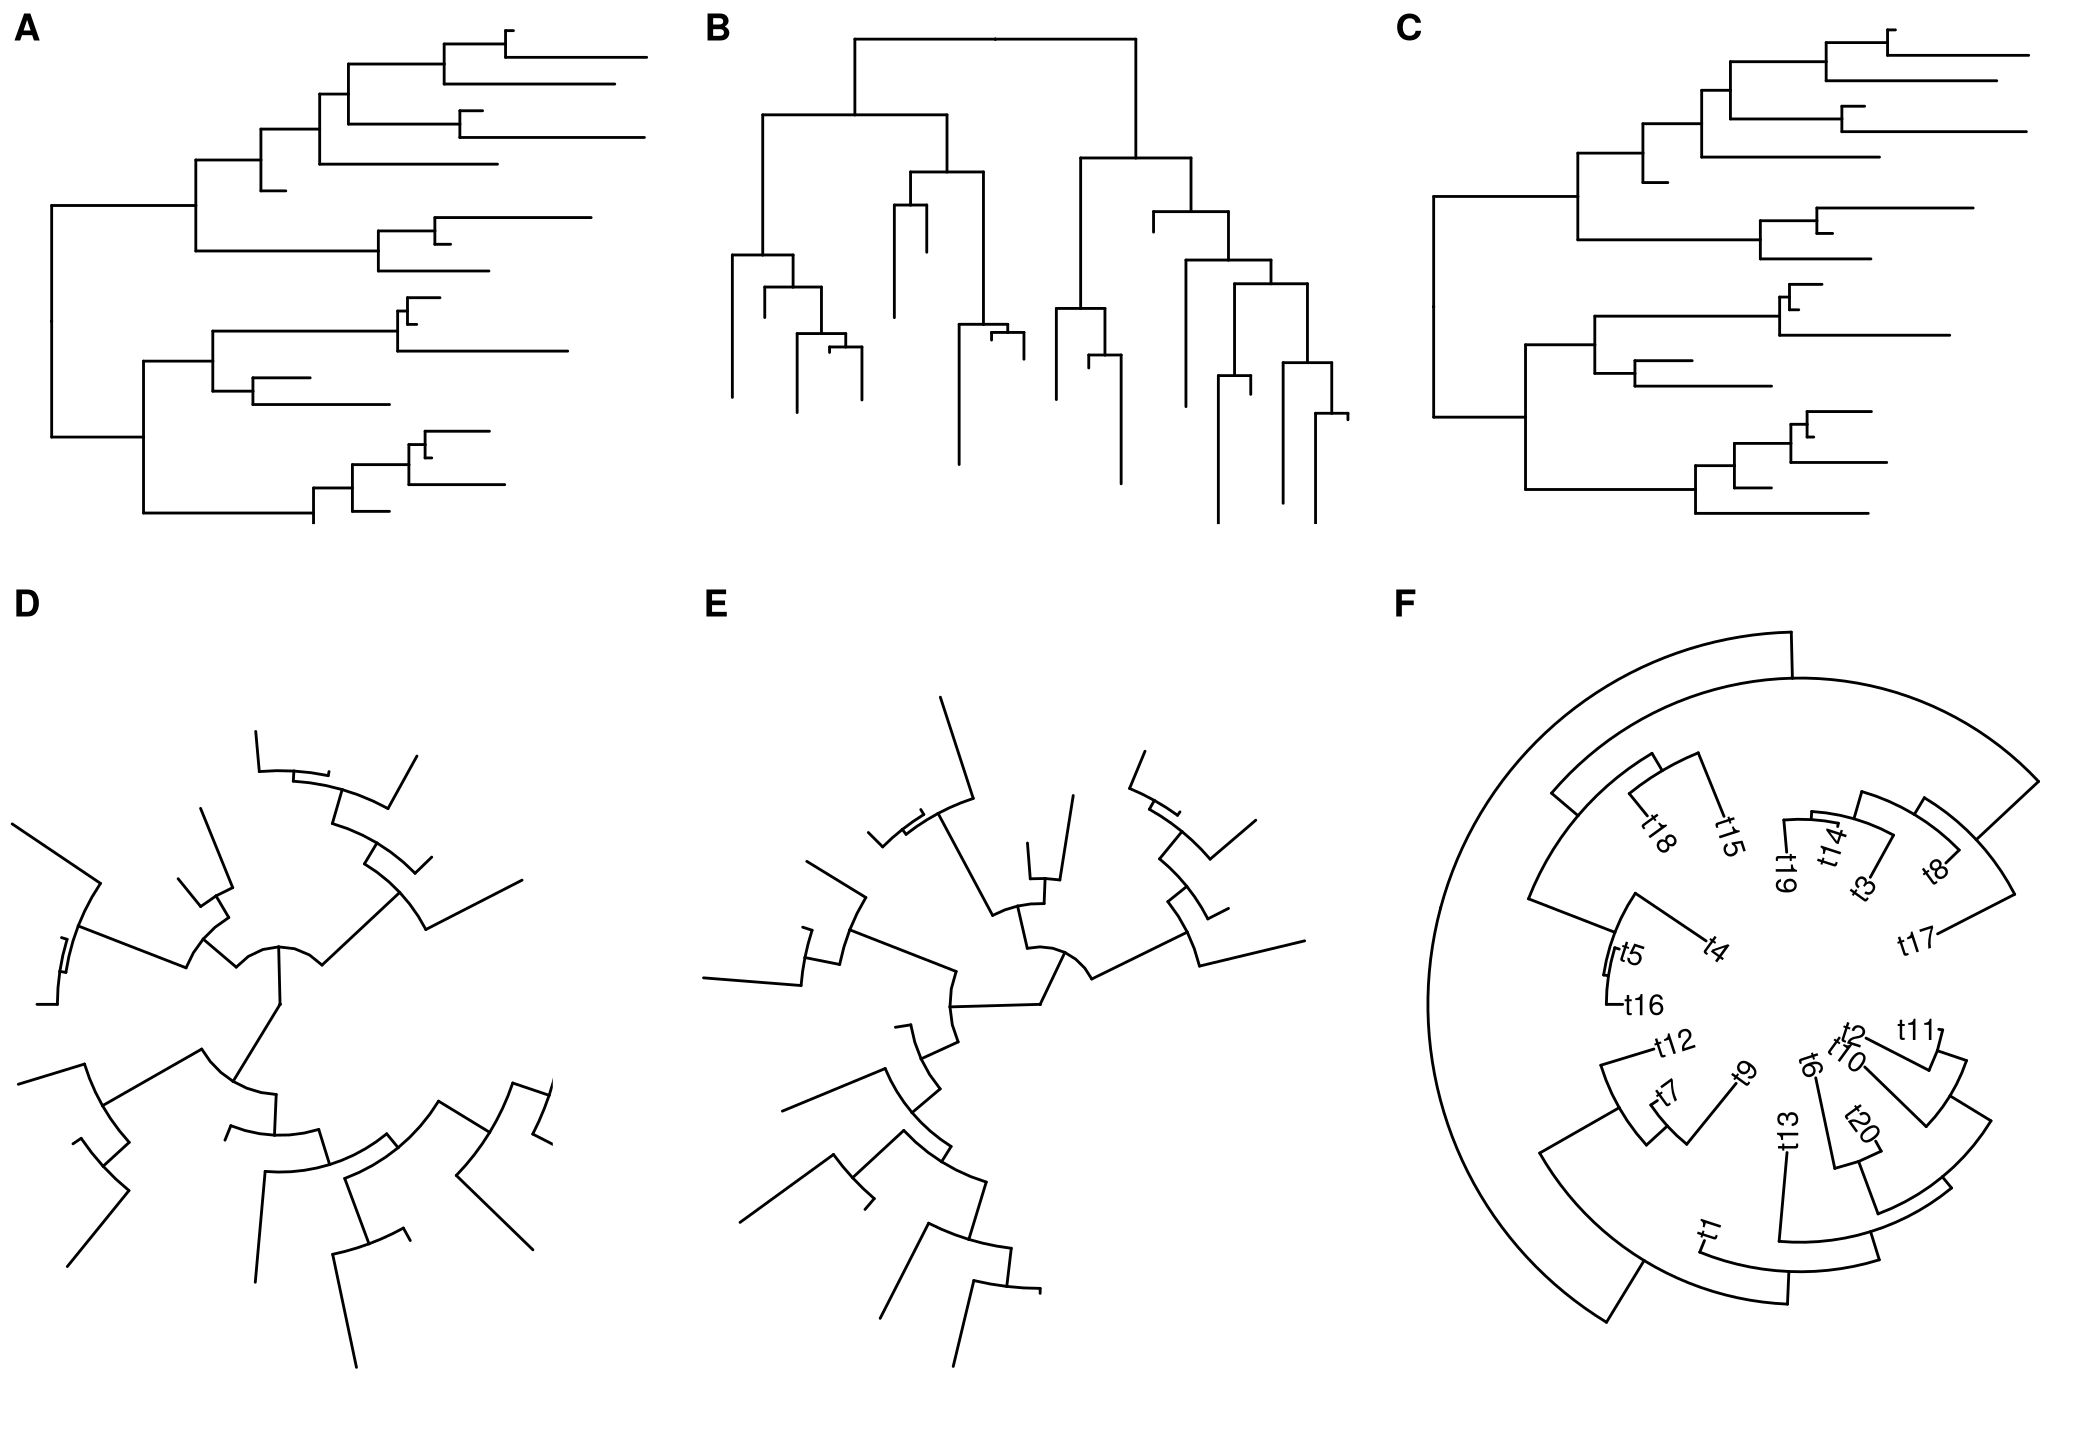
Figure 12.4: Layout layers for transforming among different layouts. Default rectangular layout (A); transform rectangular to dendrogram layout (B); transform circular to rectangular layout (C); transform rectangular to circular layout (D); transform rectangular to fan layout (E); transform rectangular to inward circular layout (F).
12.4 Scale utilities
12.4.1 xlim_expand
Sometimes we need to set xlim for specific panel (e.g. allocate more space for long tip labels at Tree panel). However, the ggplot2::xlim() function applies to all the panels. ggtree provides xlim_expand() to adjust xlim for user specific panel. It accepts two parameters, xlim and panel, and can adjust all individual panels as demonstrated in Figure 12.5A. If you only want to adjust xlim of the Tree panel, you can use xlim_tree() as a shortcut.
set.seed(2019-05-02)
x <- rtree(30)
p <- ggtree(x) + geom_tiplab()
d <- data.frame(label = x$tip.label,
                value = rnorm(30))
p2 <- facet_plot(p, panel = "Dot", data = d,
            geom = geom_point, mapping = aes(x = value))
p2 + xlim_tree(6) + xlim_expand(c(-10, 10), 'Dot')
The xlim_expand() function also works with ggplot2::facet_grid(). As demonstrating in Figure 12.5B, only the xlim of virginica panel was adjusted by xlim_expand().
g <- ggplot(iris, aes(Sepal.Length, Sepal.Width)) +
    geom_point() + facet_grid(. ~ Species, scales = "free_x")
g + xlim_expand(c(0, 15), 'virginica')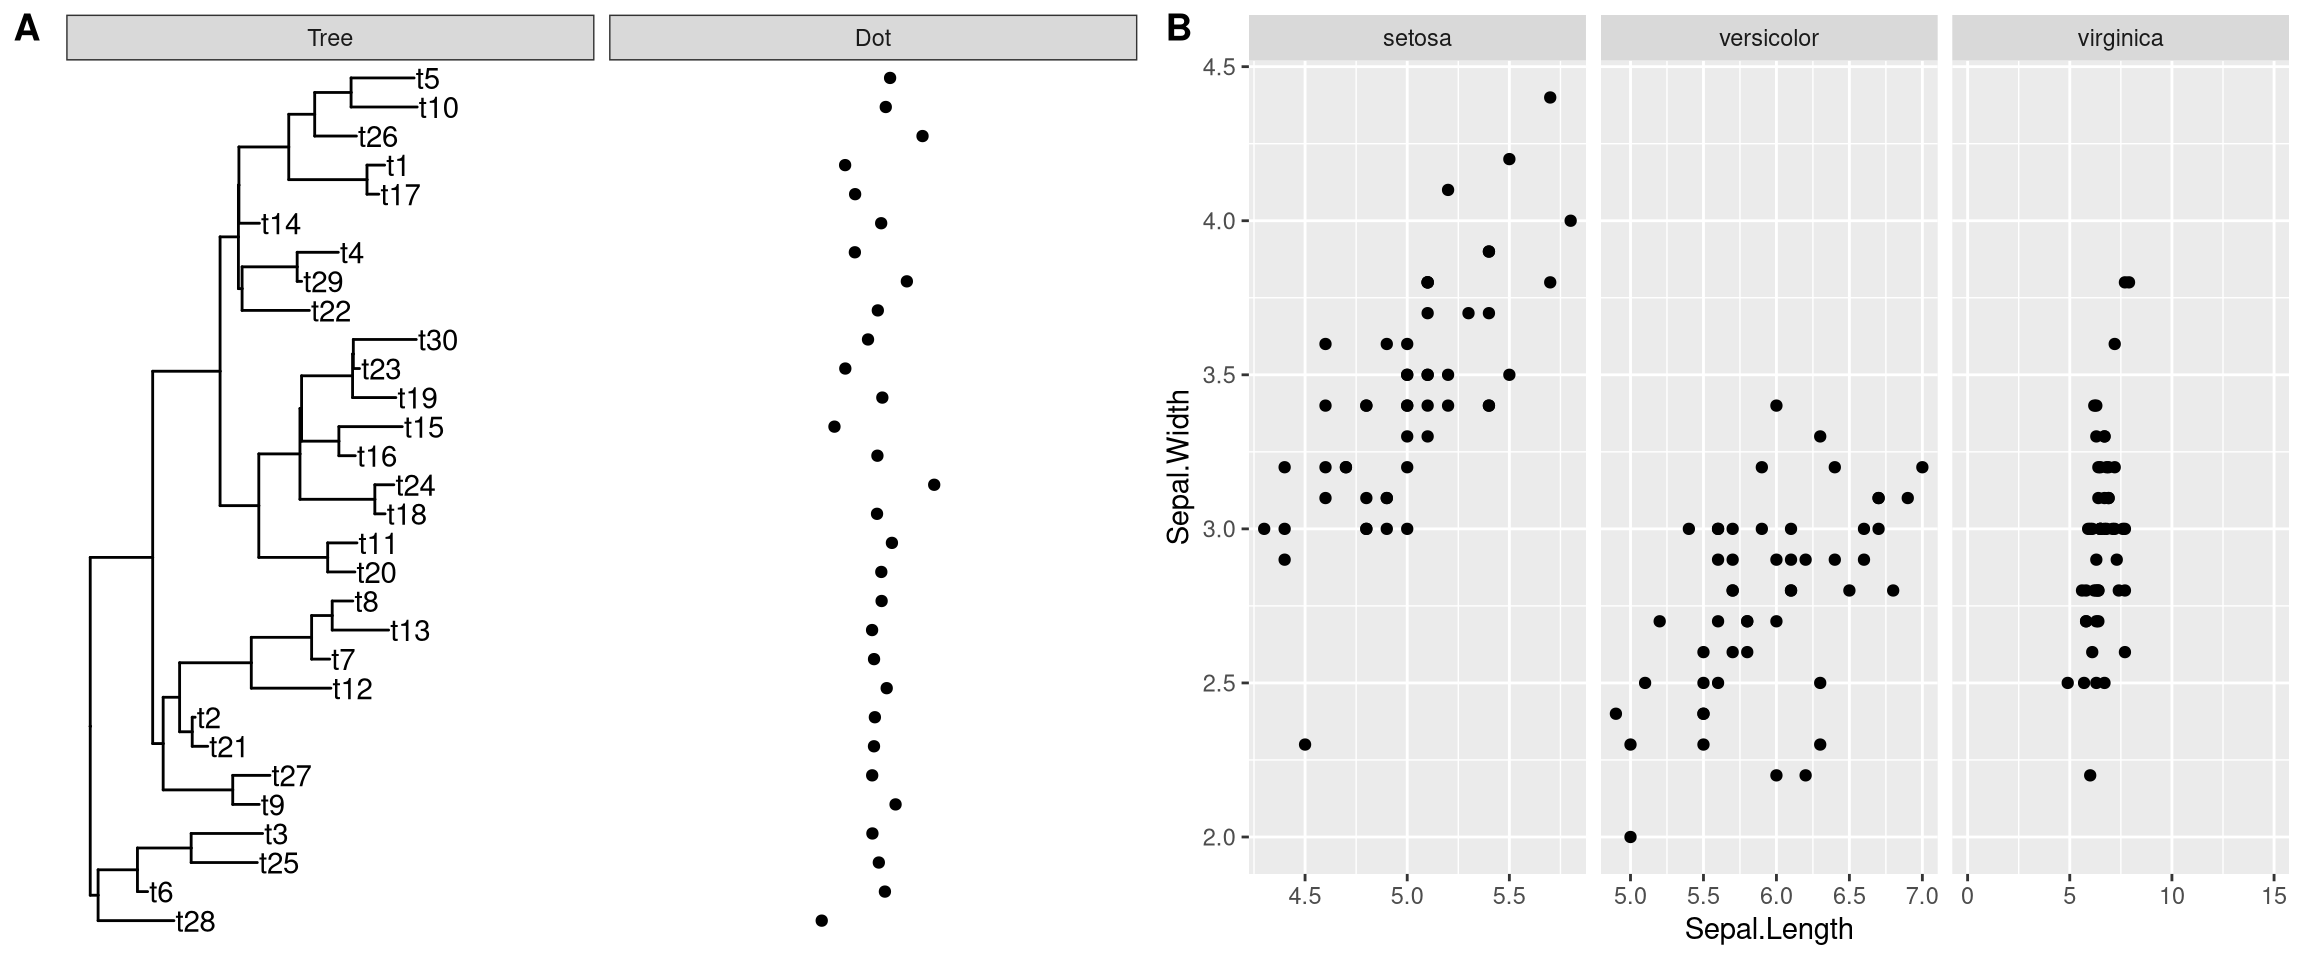
Figure 12.5: Setting xlim for user specific panel. xlim for ggtree::facet_plot (A, Tree and Dot panels), and ggplot2::facet_grid (B, virginica panel).
12.4.2 hexpand
ggplot2 cannot automatically adjust xlim and it is very common that long text can be truncated. Users need to adjust x limits manually via the xlim command (see also FAQ: Tip label truncated).
xlim is a good solution to this issue. However, we can put the thing more simple, by expanding the plot panel by a ratio of the axis range without knowing what the exact value is.
We provide hexpand function to expand x limit by specifying a fraction of the x range and it works for both direction (direction=1 for right hand side and direction=-1 for left hand side) (Figure 12.6).
x$tip.label <- paste0('to make the label longer_', x$tip.label)
p1 <- ggtree(x) + geom_tiplab() + hexpand(.3)
p2 <- ggplot(iris, aes(Sepal.Width, Petal.Width)) +
    geom_point() + hexpand(.2, direction = -1)
plot_grid(p1, p2, labels=c("A", "B"), rel_widths=c(.6, .4))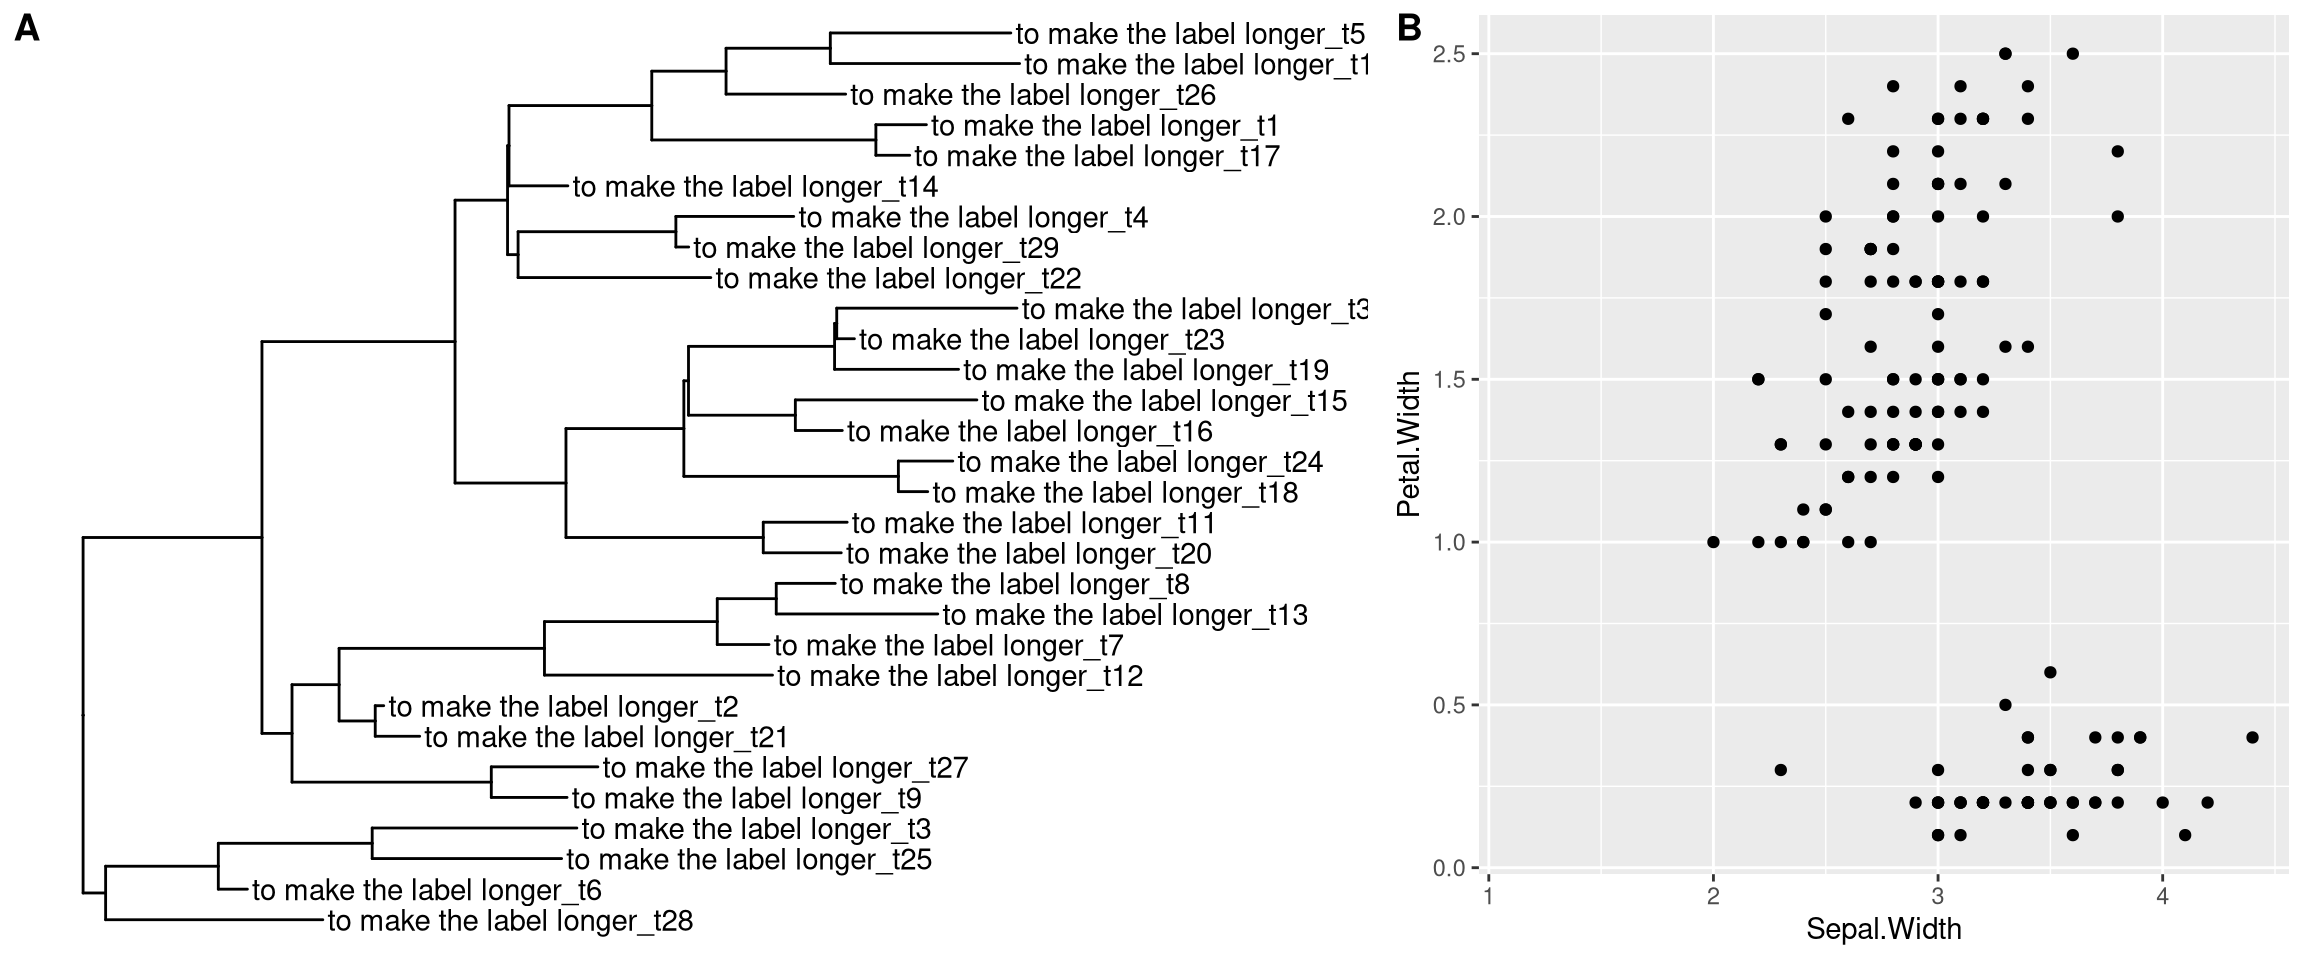
Figure 12.6: Expanding xlim by a fraction of x range. hexpand for ggtree (A), and ggplot2 (B).