My Blog: projects, sketches, works in progress, thoughts, and inspiration.

Tagged: audio

So. In the past, I’ve dabbled in sounds and have worked with sound as components of other projects such as games. More recently, in the past few months, I’ve been looking to create audio works which are more able to stand on their own. Here are my first three works.

Audio clip: Adobe Flash Player (version 9 or above) is required to play this audio clip. Download the latest version here. You also need to have JavaScript enabled in your browser.

Audio clip: Adobe Flash Player (version 9 or above) is required to play this audio clip. Download the latest version here. You also need to have JavaScript enabled in your browser.

Audio clip: Adobe Flash Player (version 9 or above) is required to play this audio clip. Download the latest version here. You also need to have JavaScript enabled in your browser.

I won’t apologize too much. It’s probably clear I’m new to this, but I think it’s important that I get it on the internet. Any feedback is very much appreciated. Thanks in advance internet.

All of the original audio was either created in Pure Data or sampled from recordings around Baltimore. Thanks very much to Andy Mangold and Dai Foldes for the audio recorder. Samples were processed in Audacity and Adobe Soundbooth and arranged in Ableton Live.

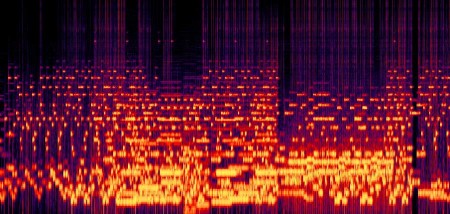
Song 3: Audio SpectrumAudio spectrum visualization of a section of the third track. Click to enlarge.
Post Page »

For a while I’ve been interested in exploring sound as a new medium. Pure Data is a sound program which I’ve been particularly interested in. The program is something like a visual programming language, with a similar interface to quartz composer. Objects which represent chunks of code are placed on the canvas. These objects have inputs and outputs through which they send and receive data in the form of numbers, strings, and audio signals. Some graphic interface elements call also be added to control applications.

Starting to work with Pure Data is a little intimidating. Objects added to the stage are blank and you have to type into them what object the should be. Until you understand what the basic objects are and how they interact trying to get anything working isn’t easy. For at least a good while I’ve been opening up Pure Data every few months only to put it away again after beating my head against it for a while.

For my recent flash game, Pulsus, I decided to create the sound using Pure Data to force myself to learn the program. I managed to cobble together a basic understanding and build a few synthesizers and sound generators.

pure-data-tone-generator-450

I used this first patch to create most of the sound effects in the game. For a number of oscillators the pitch and envelope can be changed. The pitches can create harmonics, harmonies, or dissonant chords. The envelope, the volume over the course of the sound, creates pulsing tones, short beats, and any other type of tone. I also added an amplitude modulator and a global envelope to add some more control.

pure-data-monosynth-450

In my next experiment I created a simple mono synthesizer. Key inputs, from my computer keyboard, are mapped into midi notes. When a key is pressed the frequency slides to that note if another note is still playing. Key presses trigger the envelope generator which reads data from an array (top right). The synth also has frequency and amplitude modulators and reads the waveform from a table to include harmonics.

pure-data-polysynth-450

Next I build a polyphonic synthesizer which has a separate oscillator for every note in the scale.

Here are the pure data files for these patches in case they might be useful to anyone, but again they are not super efficient, organized, or annotated.

These are my first moderately successful explorations with Pure Data. Some things, I realize, are not done as efficiently as possible, but I’m working things out in the next iteration. My next frustration is to find a way to control the instruments I build. I need a midi sequencer with which I can construct songs that could then send the midi info to Pure Data. I tried using a garage band plugin to output midi info from garage band but It came out pretty garbled in PD, I could be doing something wrong though. Any thoughts on how I should go about this?

Post Page »
I’ve been interested in experimenting with electronic music for a while now and also recently started doing some work with the Arduino. So I thought, ‘why not try both?’ I began with a great article I found on Make Magazine (one of my absolute favorite sites) to create the basic script to generate an audio signal with an Arduino. A Digital to Analog Converter (DAC) converts the binary outputs from the Arduino into a relatively fluid scale of voltages which make up the sound wave

On the electronics side, my setup is quite similar to my reference, with the addition of a small amplifier using an LM386 op amp chip and a couple resistors and capacitors for some basic filtering. On the code side I’ve created a much more substantial instrument. Using Processing I built an interface to create a 32 sample waveform and a melody. The data is sent live to the Arduino which places the data into it’s waveform array and then using a timer writes each value sequentially to the DAC to create the sound.

arduino_synthesizer_dac

The interface contains two sets of sliders. One represents the shape of the sound wave. Changing the shape alters the timbre of the sound. The second set controls a series of pitches. The currently playing note is lit and a light bar indicates the current position of the playhead. The waveform sliders can be adjusted individually or as a group by clicking and dragging across the set. The sequence bars control both the pitch and the frequency of the notes.

arduino_synthesizer_interface

Read On »

Read On (Post Continues) »

processing audio waveform & spectrum 1

processing audio waveform & spectrum 2

This is a quick little audio visualizer I put together with Processing and the ESS Sound Library. The audio spectrum is analyzed with an FFT and spectrum bands are plotted as vertical bars. The Waveform is drawn over the bars in white, adding a lot of interest to the image. To create the fading effect of the object a transparent, white rectangle is drawn over the whole sketch instead of using a background. Previous frames are left on the screen and are slowly covered up by white.

To create an interesting color scheme each bar is colored based on its own height and its neighbors. Combined with the overlapping shapes a broad range of tones and hues is created.

processing audio waveform & spectrum 3

Read On »

Read On (Post Continues) »

In my last post I explained how to control the brightness of multiple light emitting diodes connected to an Arduino with an interface scripted in Processing. The script which I created was great because it just took a series of values sent via USB and lit the LED’s appropriately. This is convenient because it is not specific to any input which might be needed to control the lights. The script to send a value serially along with an indicator character can be added to any Processing script. Naturally one of the first things I had to do with it was create an audio visualizer. With the Arduino programmed as it was all I had to do was use a sound library to break an audio input into frequency bands and send the values down.

arduino led audio visualizer

The circuit is pretty straight forward. Six LED’s are connected through resistors to the six pins which support PWM (3, 6, 5, 9, 10, 11) and to a ground pin. I have everything crammed onto a tiny breadboard on my proto-sheild cause it’s cute and self contained. That’s just my style. PWM stands for Pulse Width Modulation and is the a way to control the brightness of LED’s as well as some other components. It is a digital output and produces the effect by switching on and off very quickly. The result can be visualized as a square wave. When you send a higher value to a PWM pin it will spend more time on than off. This blinking is faster than we can see so the LED appears to be changing brightness according to the amount of time it spends in the on position.

pulse width modulation graph

Read On »

Read On (Post Continues) »

3d sound form

Working in 3d in Processing is all well and good but does have it’s limits in terms of rendering. To get a better rendering of three dimensional forms created with Processing it’s possible to export them to a file that a 3d modeling program can read. From my experience, the exported file isn’t perfect, but with a little work it can be turned into a nice model. A Processing script generated a 3d grid based on sound, the three axes representing amplitude, frequency, and time. Using the DXF library, I exported the model.

This raw data is a little bulky and has a few issues. All the segments of the form were separate objects. After importing the script into Blender (a free 3d modeling and animation program) I selected all the objects, joined them, and then in edit mode removed doubles. This combines all the meshes if they are lined up. Then using the ‘make faces’ on auto will fill in all triangles and quads. The image above was also extruded to give it some form and has a subsurface modifier for a smoother look.

Post Page »

3d Sound GridAlthough Processing does not have the ability to process audio on it’s own there are a few libraries which can be used to add such features. I’ve been experimenting with the ESS library but you can find others from the processing libraries page. Gathering Data from live or recorded sound can be a powerful tool for artists and designers in creating interactive applications, audio visualizers, music videos, or anything else that could involve an interaction with sound. Getting the data is fairly straight forward and the script returns an array of data updated each frame. This demonstration with display the data very simply, however, the numbers could be applied to any attribute in any system to produce different effects.

Here are the steps to creating a simple script to get the spectrum data from a microphone into a processing sketch. Using pre-recorded sound is similar. Once the data is in the sketch it can be manipulated and used to generate graphics or effect other aspects of a program including complex forms in 3d space using the OpenGL or P3D libraries. Read On »

Read On (Post Continues) »

A variation on a script I’ve been working with to generate a 3d visualization of an audio spectrum. The color and position of the first row of cubes is based on spectrum values and then passed down the array with a decay factor. Created with Processing using the OpenGL library to create the 3d environment and ESS to gather sound data.

Another variation renders a 3d grid rather than an array of cubes.

Post Page »

This Processing application uses the audio spectrum values to generate a 3d visualization. The first row of the 2d array gets it’s values from the audio input and all subsequent rows take the previous one’s each frame, multiplied by a decay factor. the result is this undulation 3d grid. The script uses the OpenGL library to handle the 3d environment and the ESS sound library to get the audio spectrum.

Post Page »