My Blog: projects, sketches, works in progress, thoughts, and inspiration.

Tagged: data visualization

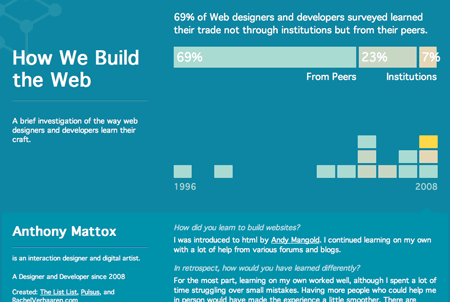
HowWeBuildTheWeb is an informal research piece which explores how web designers and developers learn their craft. I had hypothesized that most learned primarily outside of institutions from their peers, either in person or through the web. So far this is overwhelmingly the case.

Visit HowWeBuildTheWeb.netVisit the site.

The site asks designers and developers how and when they first learned their skills and graphs the data over time, showing time horizontally and educational source by the color. Each participant is shown as a block on the timeline. Clicking on each will show more detailed information including answers to a number of qualitative questions about their experience and the web in general.

Check out the site to see peoples responses and how the education of web designers has changed over time. If you make websites, contribute and share your experience.

On a technical side, the site consists of two main components, a form and a set of data visualizations. Form design is a complex art. I used a few common techniques to make it easier to use. The form is organized by the type of information, large fields are shrunk while they are empty, and lists are extended as necessary. There’s also a sneaky login system that I did my best to hide. After submitting, users can edit their information and resubmit. If they return to the page much later, clicking the edit link will let them enter their email and password.

The data visualizations are primarily handled with PHP, HTML, and CSS. The timeline is a table (the first html table I’ve ever made ever). Cells that represent individuals have classes and other attributes so they are colored and clickable. The table handles all of the scaling. The area graph is just a couple of divs with style attributes dropped in for the width. Nothing too fancy.

The site is built on my favorite frameworks: Codeigniter, a php library, and jQuery, for a few javascript touches.

Post Page »
processing audio waveform & spectrum 1

processing audio waveform & spectrum 2

This is a quick little audio visualizer I put together with Processing and the ESS Sound Library. The audio spectrum is analyzed with an FFT and spectrum bands are plotted as vertical bars. The Waveform is drawn over the bars in white, adding a lot of interest to the image. To create the fading effect of the object a transparent, white rectangle is drawn over the whole sketch instead of using a background. Previous frames are left on the screen and are slowly covered up by white.

To create an interesting color scheme each bar is colored based on its own height and its neighbors. Combined with the overlapping shapes a broad range of tones and hues is created.

processing audio waveform & spectrum 3

Read On »

Read On (Post Continues) »

world_stem_cell_map_b1

world_stem_cell_map_b3

world_stem_cell_map_b2

I’ve been working for a while on this project with Stem Cell Resources for the new cell exhibit at the Maryland Science Center. The exhibition, including the Stem Cell Map and some other fun interactive works, opened yesterday and was received very well. If you’re in Baltimore its worth checking out. Developing this project has a been a great opportunity to do some great educational work with some great people. I enjoy being able to maintain a connection with the sciences despite focusing myself on art, and I always love creating data visualizations.

The Map is scripted in Actionscript 3 and takes all the data from an xml file exported from a spreadsheet making it easy to update. The research is broken down into three categories and each location is colored accordingly and scaled based on the number of facilities. It’s displayed on a large touchscreen in the exhibit and will also soon be online.

Read On »

Read On (Post Continues) »

stem cell map

Most of the time I have been dedicating to working with Processing has recently been taken up by a larger project. It’s been very exciting for me, but less conducive to blogging both because it’s a larger project, and because I’ve been doing a lot of learning for the project. The piece is an interactive map for an upcoming exhibit for the Maryland Science Center and will be on a large touchscreen. It’s a great project for me as I love data visualization and science.

The application is scripted in Action Script 3. I was originally thinking of using Processing, but I wasn’t happy with how it was handling some things i needed it to do. So far I’m very happy with the choice. Flash is quite a tough beast to work with but I’m impressed with how quickly it parses the sizeable xml file with all the data and also how smoothly it renders all the graphics. I’ve also had to do quite a bit of learning about xml. With a bit of work I have the flash file reading xml directly exported from a spreadsheet editor, making it very easy to be updated.

I’ll write more when the project is finished. I still have to do some work building the interface and making the interaction a little more fluid. The applet will also be available online as well as in the exhibit. For now here are a few images of other visualization methods I’ve been playing with.

stem cell map 3

Read On »

Read On (Post Continues) »

Wikipedia Structural Map

The next step in my Wikipedia project is to create a static map of the entire site (more than 2.5 million pages). I’m not entirely sure how large the image will be, but judging by small scale renders the vector file should be no more than a two or three hundred megabytes. This is huge, but to be honest not as large as I expected. I’m building a new script which will not render any of the pages on the screen and will run autonomously, first getting the data, then organizing it, modifying placement to prevent overlapping text, and finally exporting a PDF file. Hopefully I can build the script to sacrifice time for a lack of power so I can use computers currently available to me.

Post Page »

wikiweb

WikiWeb is a piece created in Processing which creates a live, interactive visualization of Wikipedia. I’ve rescripted aspects of the code to make it run a little better and also added a better user interface, hopefully making it easier to use. The new version includes a toolbar of possible actions and a help and reset button. Any feedback on the changes or the project in general is very much appreciated.

Post Page »

wikiweb

I’ve been working for a while on a project I have named WikiWeb. Coding in Processing I built a program which generates a live, interactive visualization of Wikipedia. The applet works by downloading the source code for each page. The html is passed through a function which detects all the internal links and creates a new object for each. It also creates new link objects connecting the new pages with their parent and for any other pages which are linked. The applet also opens up pages in a new window, making it functional as well as fun.

I’ve built a site to house the project with some more information, however this post will serve as an area for comments about the project. The site employs spry JavaScript framework for some smooth effects.

Post Page »