Note
Go to the end to download the full example code.
Vertical diffusivity
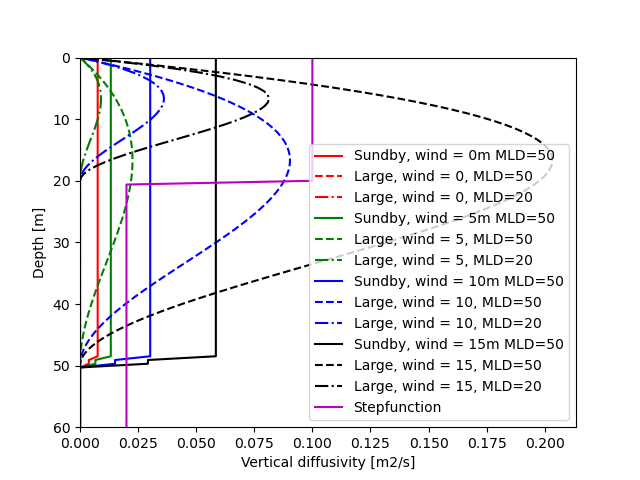
Plot the depth dependence of vertical diffusivity from the various analytical methods
import numpy as np
import matplotlib.pyplot as plt
from opendrift.models.physics_methods import verticaldiffusivity_Sundby1983, verticaldiffusivity_Large1994, verticaldiffusivity_stepfunction

depth = np.linspace(0, 60, 100)
windspeed = np.arange(0, 20, 5)
colors = ['r', 'g', 'b', 'k']

for w, c in zip(windspeed, colors):
    plt.plot(np.ones(depth.shape)*verticaldiffusivity_Sundby1983(w, depth, 50),
             depth, c + '-', label='Sundby, wind = %sm MLD=50' % w)
    plt.plot(verticaldiffusivity_Large1994(w, depth, 50), depth,
             c + '--', label='Large, wind = %s, MLD=50' % w)
    plt.plot(verticaldiffusivity_Large1994(w, depth, 20), depth,
             c + '-.', label='Large, wind = %s, MLD=20' % w)

plt.plot(verticaldiffusivity_stepfunction(depth), depth,
         '-m', label='Stepfunction')

plt.xlabel('Vertical diffusivity [m2/s]')
plt.ylabel('Depth [m]')
plt.gca().set_ylim([0, depth.max()])
plt.gca().set_xlim([0, None])
plt.gca().invert_yaxis()
plt.legend()
plt.show()

Total running time of the script: (0 minutes 0.696 seconds)