eRhapsody provides a number of diagnostic tools provided within the following Rhapsody applications:
Management Console
The Management Console is the main application for monitoring the state of the Rhapsody engine and inspecting messages that have been processed. Depending on the nature of the issue, a group of messages can be individually inspected to understand what processing has occurred to them. Log files for one or more components of the system can be reviewed (for example, a communications point that is unable to connect to an external system frequently generates log messages that indicate why the connection failure has occurred). Performance information can be inspected to assist in understanding any performance problems that might have been reported. Specifically:
- You can search for specific messages and determine how they have been processed in Message View.
- You can generate a thread dump, or download a zip archive of the Rhapsody log files and system details when diagnosing a problem.
- You can generate reports relating to message latency, response latency, performance statistics, message breakdown and engine uptime.
- You can inspect system or audit logs.
- You can diagnose archive clean up problems.
Rhapsody Logs
When the issue is preventing Rhapsody from running or is affecting many parts of the Rhapsody, the on-disk log files often provide additional information. Refer to Rhapsody Log Files for details. Log files can be found in the log directory under the main Rhapsody installation folder. A number of log files are created in this directory:
| Filename | Description |
|---|---|
log.txt |
Contains a text version of the main log information for Rhapsody. The information presented in this file is the same log information as presented as part of each Rhapsody component in the Management Console. By default every time the log file exceeds 5 MB in size, a new file is created and the existing file renamed with a numeric suffix. Only the ten most recent files are retained. Any older files are automatically deleted. |
wrapper.log |
The wrapper log file contains information from the service wrapper. This will typically contain basic service start/stop information along with information related to any Java crashes or unexpected restarts. The log file also contains memory garbage collection information that can be of value when diagnosing memory or crash related issues. |
When Rhapsody is running on a Windows® machine, information is also written to the Windows® Event Log. The information logged mirrors information in any Rhapsody notification events generated. Refer to Windows® Event Viewer for details.
Rhapsody IDE
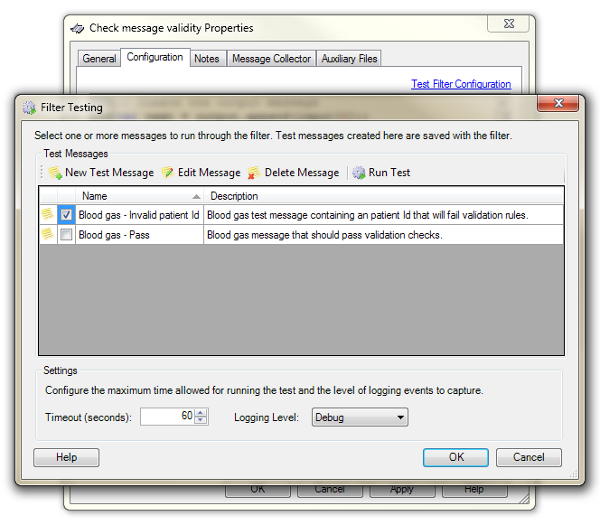
If a problem with the Rhapsody configuration is suspected, then Rhapsody IDE can be used to gain an understanding of how the configuration has been developed. The Test Filter Configuration feature of Rhapsody IDE can be used to check the behavior of individual filters for issues.
Any documentation associated with either routes, filters or communications points is viewable from Rhapsody IDE. When used in conjunction with the Management Console, Rhapsody IDE can be used to troubleshoot the reason why a particular message or group of messages has been processed a certain way.
