Tips And Tricks
Console
Write multi-line commands
When in the console's multi-line editing mode, you can treat blocks of text as if you were using a standard text editor. Shift + Enter allows you enter multi-line mode in the console.

This can be particularly helpful when writing JavaScript that is more complex than a simple one-liner. Once you've entered a block of text, press Enter at the end of the command and it should run.

For a multi-line console which supports persistence, read about Snippets - a feature which can save and execute custom snippets of JavaScripts which are always available inside the DevTools.
A shortcut to launch in inspect-element mode
Ctrl + Shift + C or Cmd + Shift + C will open up DevTools in inspect element mode (or switch focus to it) so you can inspect the current page immediately. Repeating returns focus to the page. On Mac, use Cmd + Shift + C to achieve the same.
More: Using The Console | DevTools Docs
Support for the console.table command
This command logs any supplied data using a tabular layout. Some examples of how to use it include:
console.table([{a:1, b:2, c:3}, {a:"foo", b:false, c:undefined}]);
console.table([[1,2,3], [2,3,4]]);

There is also an optional 'columns' parameter which takes the form of an array of strings. Below, we define a family object containing many "Person"s and can then choose which columns we would like displayed using it:
function Person(firstName, lastName, age) {
  this.firstName = firstName;
  this.lastName = lastName;
  this.age = age;
}

var family = {};
family.mother = new Person("Susan", "Doyle", 32);
family.father = new Person("John", "Doyle", 33);
family.daughter = new Person("Lily", "Doyle", 5);
family.son = new Person("Mike", "Doyle", 8);

console.table(family, ["firstName", "lastName", "age"]);

whilst, if you just want to output the first two of these columns, use:
console.table(family, ["firstName", "lastName"]);
More: Support for the console.table command has landed | G+.
Preview logged console objects
Objects logged using console.log() can be previewed directly inside the DevTools without further work on your part.

Pass multiple arguments to styled console logs
As we've documented you can add style to your console logs via %c, just like you can in Firebug. e.g
console.log("%cBlue!", "color: blue;");
Blocks specifying multiple styles are also supported:
console.log('%cBlue! %cRed!', 'color: blue;', 'color: red;');

More: Styled Console Logging In The DevTools | G+
Shortcut to clear the console history
With the console open you can easily clear your console history using the Ctrl + L or Cmd + L shortcut. A clear() command is also available at the shell prompt as is the console.clear() method via the Console API from JavaScript.
Become a keyboard ninja
With the DevTools open you can just use ? to see all of the supported shortcuts in a convenient panel.

Accessing elements from the console
Select an element and type $0 in the console, it will be used by the script. If you have jQuery on the page, you can then use $($0) to reselect the element in the page.

You can also right click on any element output to the console and click 'Reveal in Elements Panel' to find it in the DOM.

Querying the DOM using XPath expressions
XPath is a query language for selecting nodes from documents and generally returns a node-set, string, boolean or number. You can use XPath expressions to query the DOM from the DevTools JavaScript console.
The $x(xpath) command will allow you to execute a query - see below for an example of how to search for the images in a page using $x('//img'):

However, the function also accepts an optional second argument for the path context - i.e $x(xpath, context). This lets us select a specific context (e.g an iframe) and run an XPath query against it.
var frame = document.getElementsByTagName('iframe')[0].contentWindow.document.body;
$x('//'img, frame);
which queries the images within the specified iframe.
Access the last console result
Using the $_ helper will allow you to access the last console result. We can demonstrate using this with another XPath example:

Using console.dir
The console.dir(object) command lists out all of the properties of a provided object as an expandable JavaScript object. Below is an example displaying an expandable object representing the properties found under document.body.

Running the JS console in a specific iframe
Along the bottom bar of the DevTools are drop-down options that change depending on the context of your current tab. When you’re in the Console panel, there’s a drop-down that allows you to select the frame context that the console will operate in. Select your frame in the drop-down and you’ll find yourself in the right context in no time.

Stop the console clearing when navigating to a new page
Sometimes you want to be able to preserve your console log history when you navigate to a new page. To enable this, right-click in the console and select "Preserve Log upon Navigation". When you navigate to a different page from the current tab, the console history will no longer be cleared.

Benchmark loops using console.time() and console.timeEnd()
console.time() begins a new timer using a specific label. When console.timeEnd() is called using the same label the time is stopped and the elapsed time between both is logged to the console. This is particularly useful for benchmarking loops or code which doesn’t call a function.

Profiling with console.profile() and console.profileEnd()
With the DevTools open, calling console.profile() begins a JavaScript CPU profile. A label for the profile can be optionally passed, as seen below in console.profile("Processing"). To complete a profile run, call console.profileEnd().

Each profile run gets added to the Profiles panel:

It is also added to the console.profiles[] array for inspection later on:

For more key tricks with the console, dive into Using The Console:
Timeline
Frame profiling with Timeline Frames Mode
The Timeline panel provides an overview of where time is spent loading up your web application such as how long it takes to process DOM events, render page layouts or paint elements to the screen. It allows you to drill down into three separate facets that can help discover why your application is slow: Events, Frames and actual Memory usage.

Timeline won’t display any data by default but you can begin a recording session with it by opening your app and clicking on the circle  at the bottom of the pane. Using the Ctrl + E or Cmd + E shortcut will also trigger a record.

This record button will turn from gray to red and the Timeline will begin to capture the timelines for your page. Complete a few actions inside your app and after a few seconds, click the button again to stop recording.

Frames mode gives you insight into the tasks Chrome had to perform to generate a single frame (update) of your application for presentation on the screen. In this mode, the shaded vertical bars correspond to recalculating styles, compositing and so on. The transparent areas of each vertical bar correspond to idle time, at least, idle on the part of your page.

For example, say your first frame takes 15ms to execute and the next takes 30ms. A common situation is that frames are synchronized to refresh rate and in this case, the second frame took slightly longer than 15ms to render. Here, frame 3 missed the "true" hardware frame and was rendered upon the next frame, hence, the length of the second frame was effectively doubled.
If your app doesn't have a lot of animation in it, the idea of frames is useful as the browser has to perform a repeated sequence of actions while processing input events. When you leave enough time to process such events in a frame, it makes your app more responsive, meaning a better user experience.

When we target 60fps, we have a max of 16.66ms to do everything. That's not a lot of time and so squeezing as much performance out of your animations as possible is important.
More: Improving Performance With The DevTools Timeline | DevTools Docs
Spot forced layout events using warnings
In the DevTools Timeline, if you see a yellow triangular icon in the Records view, this is an indication some of your code is triggering forced/synchronous layout events.
You ideally want to avoid unnecessary layout triggers as they can have a significant impact on the performance of your page.

More: Timeline Warnings Are A Performance Smell | G+
Share and analyze a Timeline recorded by someone else
You can view and share Timelines with other developers thanks to a useful import/export feature. Use Ctrl + E or Cmd + E to start & stop recording then right-click inside the Timeline and use Save Timeline data. The same menu supports Load Timeline data for loading an exported file back in for viewing.

Annotating Timeline Recordings
Your code can add annotations to Timeline recordings using the console.timeStamp() method. This helps correlate code in your web app to other activity going on or browser events.

More: DevTools Console API - Marking The Timeline | DevTools Docs
Your application can add annotations to Timeline recordings by calling the console.timeStamp() method. This lets you easily correlate code in your application to other activity in your application or browser events. In the following recording, the Timeline is annotated with the string "Adding result". See Marking the Timeline in Using the Console for example code.
FPS Counter/HUD Display
A useful tool for visualizing frame rate and jank is the real-time FPS counter. This can be enabled in the DevTools by going to the Settings menu and checking “Show FPS meter”.

When activated, you will see a dark box in the top-right corner of your page with frame statistics. The counter can be used during live editing to diagnose what in your page is causing a drop-off in frame rate without having to switch back and forth with the Timeline view.

More: Profiling Long Paint Times with DevTools' Continuous Painting Mode | HTML5Rocks
Keep in mind that just tracking the FPS counter may lead to you not noticing frames with intermittent jank. Be careful when using the content. It is also worth noting that FPS on desktop does not equal FPS on devices and special care should be taken to profile the performance there too.
For more key tricks with profiling using the Timeline, dive into Performance Profiling With The Timeline:
Profiles
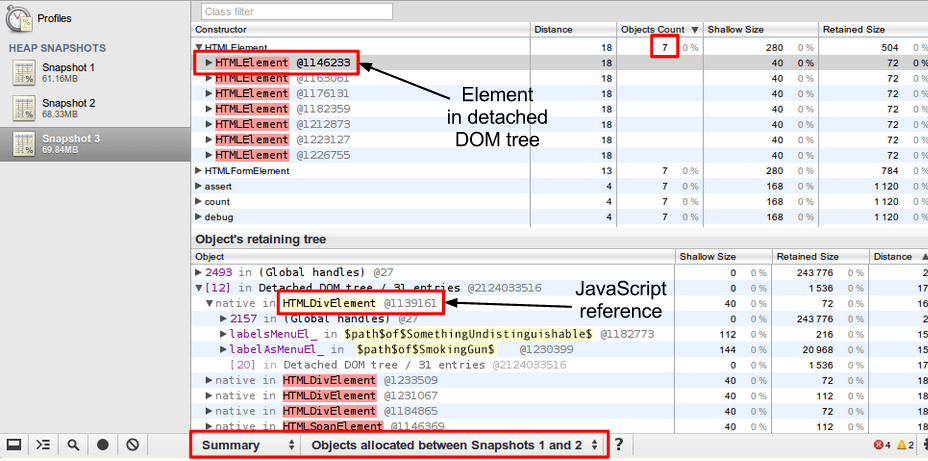
Finding JavaScript memory leaks with the '3 snapshot' technique
Open up the DevTools and switch to the Profiles panel
Perform an action in your page that makes a leak
Take a new heap snaphot
Repeat steps 2 and 3 three times
Select the latest heap snapshot
Change the filter 'All Object' to 'Objects between Snapshot 1 and 2'
You should now see a set of leaked objects. You can select one and look at the list of retainers in the Object's retaining tree for insights into what is causing leaks.

More: BloatBusters - Eliminating Memory Leaks In GMail
Understanding Nodes In The Heap Profiler
Red nodes are those that are staying alive because they're part of a detached DOM tree and there is a node in the tree referenced from JavaScript (either as a closure variable or by some property).
Yellow nodes indicate a detached DOM node reference from an object's property or an array element - there should be a chain of properties leading from the DOM window to the element (e.g window.foo.bar[2].baz).

More: Understanding Nodes In The Heap Profiler | G+
Understanding time spent in CPU profiler
In the CPU profiler, "(idle)" time is now marked as such. Time spent in non-browser processing is "(program)".

Additional insights with Heap profiler views
One common question we get asked is 'what are the differences between the Comparison, Dominator, Containment and Summary views in DevTools > Profiles > Heap snapshot'. These views provide additional insights into the data exposed by the profiler and break down as follows:
Comparison view helps you track down memory leaks, by displaying which objects have been correctly cleaned up by the garbage collector. Generally used to record and compare two (or more) memory snapshots of before and after an operation. The idea is that inspecting the delta in freed memory and reference count lets you confirm the presence and cause of a memory leak.
Dominators view helps confirm that no unexpected references to objects are still hanging around (i.e that they are well contained) and that deletion/garbage collection is actually working.
Summary view helps you hunt down objects (and their memory use) based on type grouped by constructor name. This view is particularly helpful for tracking down DOM leaks.
Containment view provides a better view of object structure, helping us analyze objects referenced in the global namespace (i.e. window) to find out what is keeping them around. It lets you analyze closures and dive into your objects at a low level.

More: Taming The Unicorn: Easing JavaScript Memory Profiling In Chrome | AddyOsmani.com
For more key tricks with memory profiling, dive into Profiling Memory Performance:
Sources
Debug on DOM modifications
Right-click an element and enable ‘Break on Subtree Modifications’: whenever a script traverses that element childs and modifies them, the debugger rolls in automatically to let you inspect what’s happening:
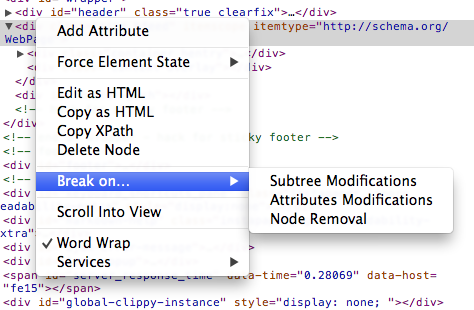
Also worth noting is that Attribute modifications pause on inline style changes which can be useful for debugging DOM animations.
Tracking uncaught exceptions
From the Sources pane, double clicking the pause script execution ( ) button will break the code when an uncaught exception occurs, preserving the call stack and the current state of the application - some refer to this as the purple pause.

Conditional breakpoint actions with console.log
The DevTools support conditional breakpoints, which we know can be set by clicking the line you wish to set a breakpoint on and applying a breakpoint as normal.
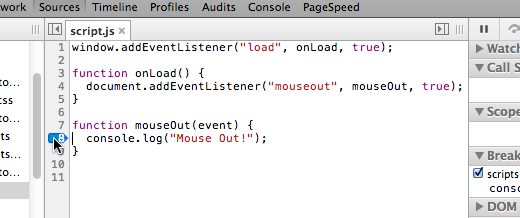
You then right-click the line and "Edit Breakpoint" where you are presented with an expression field. Define your condition here (e.g if the expression evaluates as truthy execution will break here).

A normal expression may be of the form x === 5, however console.log statements are also completely valid input in the field.

This approach works well and we can easily see the console.log statements being fired in the console on breakpoints:

As console.log doesn't have a real return value, undefined means the conditional breakpoint won't result in execution being paused and your code will continue to run. It's much like a hard-coded console.log statement without the need to modify your code directly.
More: Breakpoint Actions In JavaScript | randomthink.net
Pretty Print JavaScript
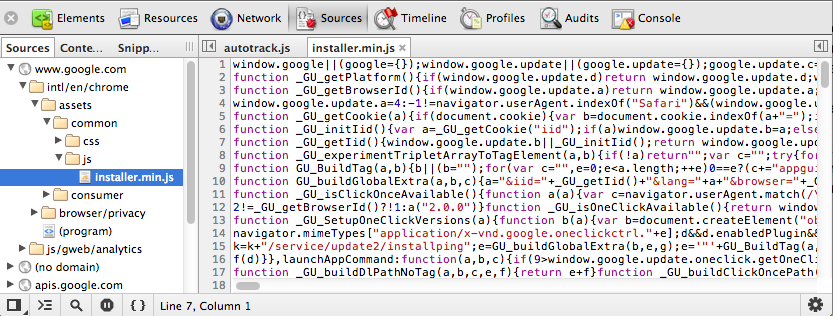
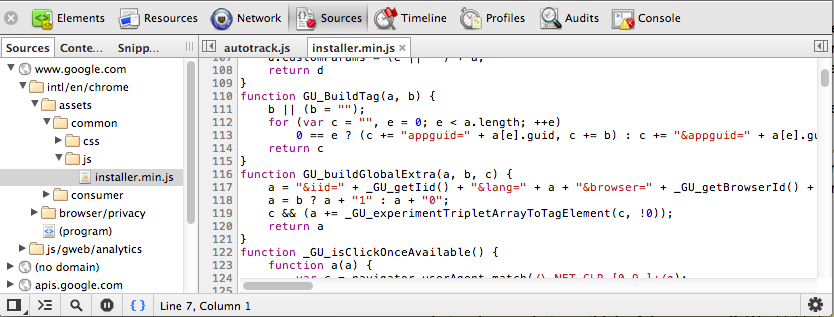
The DevTools support prettifying of minified JavaScript to a more readable form. To pretty print:
Before
After
‘Favorite’ an expression or variable value
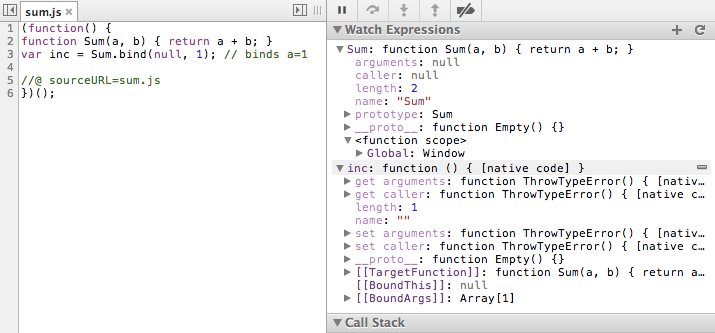
Instead of writing again and again a variable name or an expression you are going to check a lot during a debug session, add it to the ‘Watch Expression’ list. You refresh the values if you modify them directly, or just watch them change while the code runs
Get insights into internal properties
Suppose you've defined a variable of value `s` and it performs the following operation:
s.substring(1, 4) // returns 'ell'
Do you think that `s` is a string? Not necessarily. It also can be a string object wrapper. Try the following in watch expressions:
"hello"
Object("hello")
First is a regular string value, the second is a full-featured object. As confusing as it could be, the two values behave almost identically. But the second one has real properties and you can set your own too.
Expand the properties list and you will notice, how it's not a completely regular object: it will have an internal property [[PrimitiveValue]], where the original string value is stored. You cannot access this property from your code, but you can see it in DevTools debugger now.
More: Learn JavaScript Concepts With The DevTools | GitHub
Easily debug XHRs
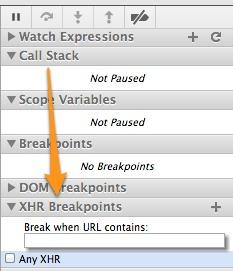
From the debugger open the “XHR Breakpoints” section, you can specify any URL (even a substring) your code should break into when doing an XHR request. Or even tell it to break on every XHR:
Retrieve event handlers registered on elements
With the "Elements" tab open, find an element in the DOM tree and click to select the node. Note: You can also do this using the console API with getEventListeners(targetNode);
Next on the right, click to expand the "Event Listeners" section. There you will find a list of all event listeners attached to the element.

Escape to see the console
When debugging in the Sources panel, you sometimes require simultaneous access to a console. Simply hit the escape key and the console panel will be displayed.
You can write and execute JavaScript in this console as expected, but what's even better is if you're paused at a breakpoint, JS executed will be within the currently paused context.

Become more effective when paused at a breakpoint
While your script is paused at a breakpoint, there are a number of useful features at your disposal.

You might know that you can move around using "Continue", "Step Over", "Step Into" and "Step Out", but there are keyboard shortcuts available for each of these buttons. As mentioned in an earlier tip, ? will bring up a panel displaying them. Learn them as they'll make you more efficient at navigating through your code.
Watch Expressions (in the sidebar to the right) will keep an eye on expressions so you don't have to keep switching back to the console (e.g X === Y). Call Stack (under it) displays function cals the system has gone through to achieve where it is at present.
In Scope Variables, you're able to right click on any function and hten use "Jump to definition" to jump to the line in your script that defines that function.
DOM Breakpoints display any "Break on" modifications taken by right-clicking on a node in the Elements panel. This is helpful for debugging whether listeners have been correctly attached to nodes and what occurs when they are invokved.
The XHR Breakpoints panel is also useful as it can setup a breakpoint for XMLHttpRequests. Specify a breakpoint by typing in a substring of the URL you wish to inspect.
Pause on exceptions
You may want to pause JavaScript execution next time an exception is thrown and inspect its call stack, scope variables and state of your app.

A tri-state stop button (  ) at the bottom of the Scripts panel enables you to switch between different exception handling modes:
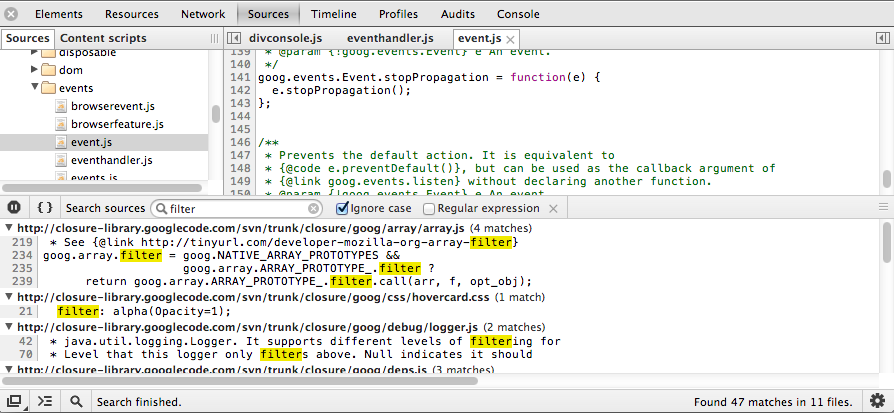
Text search across all scripts
If you wish to search across all of the files loaded for a page for a particular string, you can load up the search pane using the following shortcut:
This supports both regular expressions and case sensitive search.
Debugging CoffeeScript With DevTools And Source Maps
Source Maps provide a language-agnostic way to map compiled production code back to the original source code that was authored in your development environment.
When analyzing code generated for production, it is often minified (and in the case of a language that tranpiles to JavaScript, compiled) making it difficult to locate where the lines map to your originally authored code.
During the compilation phase, source maps can store this information, allowing you to debug production code, a line will return the exact location in the original file back to you. This makes a world of difference as you can both read and debug production code, whether it's in CoffeeScript or otherwise - as long as it has a source map.
To enable Source Maps support in Chrome:

Next:

Now when you're debugging CoffeeScript code, thanks to this statement the DevTools know where your original source file lives.
You could then take this source map and during your optimization/minification phase use a tool like UglifyJS2 to reference this first source map (CS to JS) and have it map the minified JavaScript back to the CoffeeScript and not the compiled JavaScript output. This allows you to debug production code straight back to your source CoffeeScript code.
More: NetTuts - Source Maps 101
For more key tricks with your authoring workflow, dive into Authoring And Development Workflow:
Elements
Enable rulers
Under Settings > General > Show rulers a ruler can be enabled which will be displayed when you hover over or select an element in the Elements panel.
Autocompletion of CSS properties
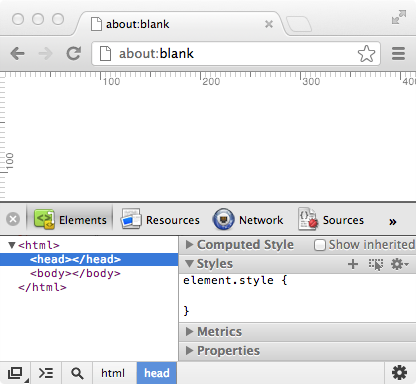
The DevTools support autocompletion of known CSS properties and values (including those requiring a prefix), which is a useful way to determine which properties can be set for the current element.
Suggestions are displayed when you begin to type in a name for for a property or value, but you can also scroll through the available options for some properties using the right arrow key. It's also useful to know that the selected item will get applied to the page stylesheet so its effect will become visible instantly.

Colors can be defined within the Styles pane using named (e.g ‘red’), HSL, HEX or RGB values. You can shift/click to iterate through these if required.
Should you wish to display all supported values for a property, you can use Ctrl + space to display a complete list of suggestions.

The list of suggestions is context-specific and in certain cases (e.g font) numeric, named and prefixed values supported will also be displayed.

Color picker in the DevTools
The DevTools include a built-in color picker which is displayed when clicking on the colored preview square next to any valid color.

You can Shift + click to change the color format of the color being selected.
Adding new CSS styles
Clicking anywhere within the opening and closing brackets for a CSS rule (including within "element.style"), allows you to add a new CSS property which will similarly be instantly applied.

Once you have finished adding a property, you can hit the tab key to set the next property.
New selectors can be added by clicking the  button to the right-hand side of the "Styles" sub-panel. This allows you to define a selector and similarly, add new properties and values as needed.
Note: You can also edit any selector in the Styles pane by single-clicking on the name of a selector. Once the name has been changed, the existing properties for the selector will be applied to the element selection defined by the new selector.

New pseudo-selectors can be added in a similar fashion, by appending them to the name of a selector. Also note that clicking on the "toggle element states"  button, to the right of the new selector button will toggle the visibility of the "Force element state" pane.

Going back to the “Matched CSS Rules” panel, clicking on the link to the stylesheet next to a rule will take you to the Sources panel. The will display the complete stylesheet and take you to the line number where the relevant CSS rule exists.

Drag and drop in the Elements panel
In the Elements panel you can drag-and-drop an element to change its position within its parent, or move it to a completely different part of the document.
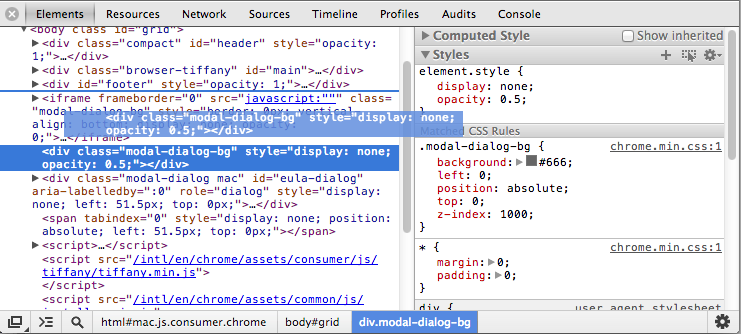
Force Element State
Want to force an element to adopt a particular state?

Writing and debugging Sass with the DevTools
Note: To use Sass debugging in Chrome you need to have version 3.3.0 (pre-release) of the Sass compiler, which is the only version that currently supports source map generation.
Working with a page containing pre-processed CSS can be a challenge as modifications made to your CSS styles within the DevTools typically won’t apply them back to your Sass source files. This means if making changes to your styles on the fly, you would need to go back and manually apply them to your source files using an external editor if you wanted to maintain them.
This is no longer an issue with recent improvements which improve the Sass development workflow. To enable Sass support:
Check to ensure you have Developer Tools experiments enabled in about:flags.
Next, go to the Settings cog > Experiments and enable “Sass stylesheet debugging” (Note that this feature will be out of experiments soon).

Go to the General menu > Settings > Check “Enable source maps” and “Auto-reload CSS upon Sass save”.

You can leave the timeout at its default value. Depending on how long the Sass compiler needs to complete its work, you may need to adjust the auto-reload delay. You can also disable auto-reload to manually reload the page as necessary.
Navigate to the page for a project you wish to debug Sass on in Chrome (with the DevTools open)
Next, fire up the Sass compiler using the following flags (which also specify a target CSS compile target):
sass --watch --sourcemap sass/styles.scss:styles.css. This will have Sass watch for changes to your Sass source files and create source map files (.map) for each generated CSS file. You should see something similar to the below in your terminal:
This confirms Sass debugging is indeed working.
If the setup worked as expected, you can go to the Elements panel. The first thing you’ll notice is that the filename for your styles will now display the corresponding .scss source file as well as the line number reflecting the line number in your source.

-
Clicking on a filename from here will take you directly to the Sources panel, with the line that corresponds to the selector highlighted. You’re now able to work with your Sass source file directly inside the developer tools with syntax highlighting in place.

-
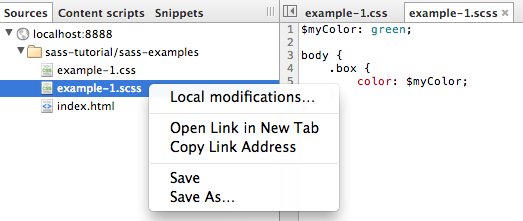
When you wish to edit a Sass file from inside the Sources panel, the one thing you need to ensure is that DevTools is aware of where this file exists in your local file system. Right-click within the editor and choose “Save As” to overwrite your original source file with the one you are editing. As auto-reloading has been enabled and Sass is running in the background, changes we make are instantaneously shown inside both Chrome and the DevTools editor.
For more key tricks with working with elements and styles, dive into Editing Styles And The DOM:
Network
Replay XHRs
As you probably know, the Network panel shows a list of all the requests your page has made including XHRs. You can replay any XHR (POST or GET) by right-clicking on the request to display the context-menu then selecting “Replay XHR”.

Clear the network cache or cookies
Right-click/Ctrl-click anywhere in Network panel and select Clear Browser Cache/Network Cache from context menu.

Record a trace & export the waterfall

More: Wait, DevTools Could Do That? | Igvita.com
Using large resource rows in network timeline for more detail
By triggering the “Use large resource rows” icon in the bottom of the Network panel, you can enable display of additional insights not found in the more compact/smaller resource rows view.

Compare the smaller resource rows view:

and the larger row version:

Tricks for getting more information out of the Network panel
Left-click on the header of the Timeline column in the Network panel to get access to further insights about network requests. You can switch between:
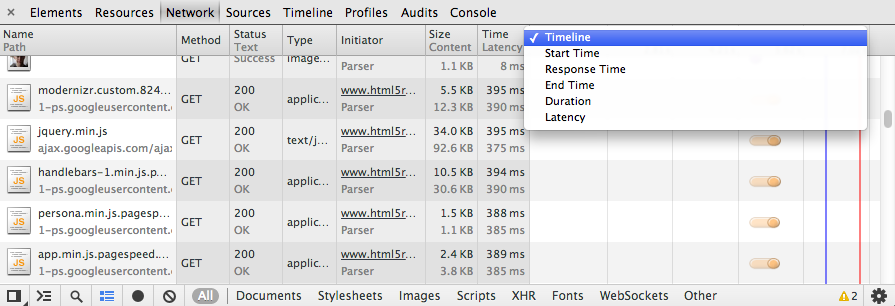
Right-click anywhere on the header of any column in the network panel and you can enable or disable columns. 3 of these columns are not shown by default:

WebSocket inspection
In the Network panel, you can use the filters at the bottom of the window to inspect WebSocket message frames.

For example, navigate to the Echo demo, select the "WebSockets" filter from the bottom of the Network panel then click the "Connect" button. Any messages you send by clicking the 'Send' button can be inspected using the 'Frames' subpanel.
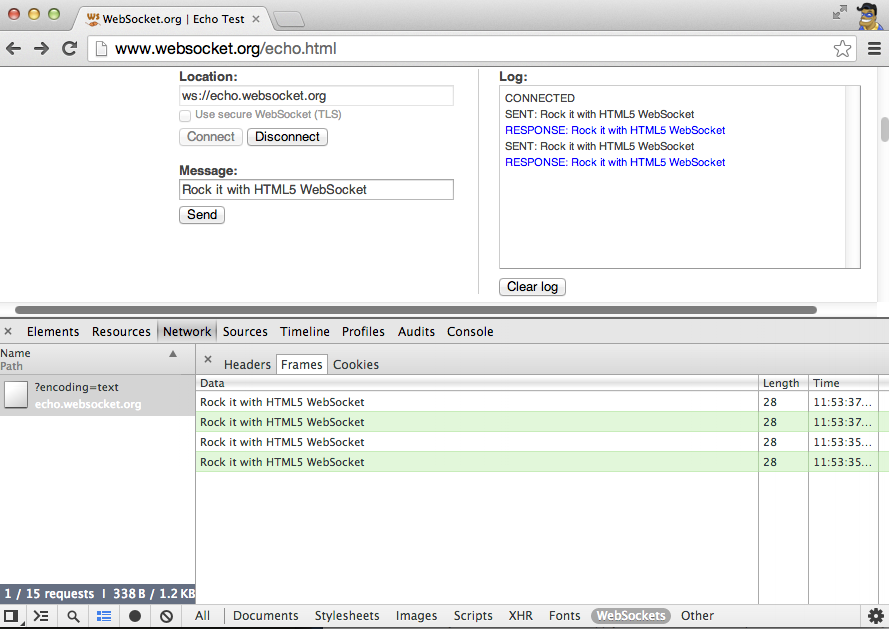
Green reflects messages sent by your client. WebSocket inspection is useful has it allows you to inspect both the WebSocket handshake as well as individual WebSocket frames.
More: Wait, DevTools Could Do That? | Igvita.com
More: WebSocket inspection with DevTools | Kaazing
Find and filter XHRs from the Network panel
When inspecting network requests in the Network panel you often need to narrow down to a specific request based on a specific keyboard. This can be easily done using theCtrl + F or Cmd + F keyboard shortcut.
In the search input field, type in the keyword you are searching for and those requests with a filename/URL matching it will be highlighted. You can flip between results using the up and down buttons beside the input field.
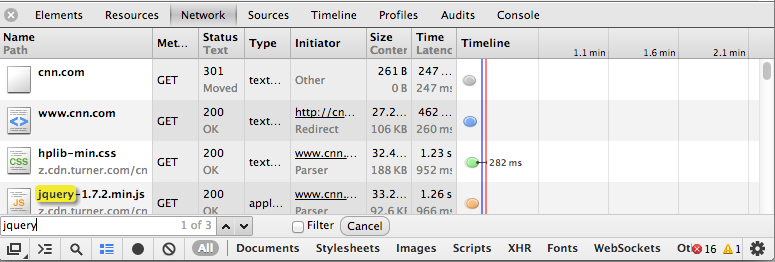
Although this is useful, it can be of more help to only display those results in the Network panel that matched your search term. Checking the “Filter” option will do this and we can see below.

More: Evaluating Network Performance | DevTools Docs
Get a dump of the network stack’s internal state
The "about:net-internals" page is a special URL that dumps a view of the network stack's internal state. This data can be helpful when debugging performance or connectivity problems. It includes information on request performance, proxy settings and DNS cache.
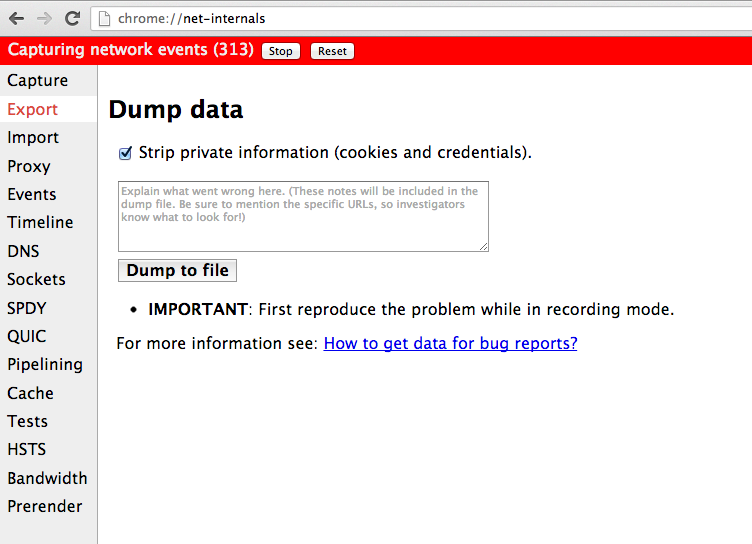
Also note that about:net-internals/#tests is able to run tests for a specific URL.
For more key tricks with measuring network performance, dive into Evaluating Network Performance:
Settings
Emulating touch events
Touch is an input method that's difficult to test on the desktop, since most desktops don't have touch input. Having to test on mobile can lengthen your development cycle, since every change you make needs to be pushed out to a server and then loaded on the device.
A solution to this problem is to simulate touch events on your development machine. For single-touches, the Chrome DevTools supports single touch event emulation to make it easier to debug mobile applications on the desktop.
To enable support for touch event emulation:
Open up the overrides menu in the DevTools
Scroll down and check “Enable touch events”

We can now debug touch events in the same way that we can with standard desktop events via Event Listener Breakpoints in Sources.
Note: A caveat with touch event emulation is that the DOM0 event handlers do not currently work with the emulation mode. See here for the relevant bug to track.
More: DevTools Mobile Emulation | DevTools Docs
Emulating UA Strings & Device Viewports
It’s often easier to start prototyping on the desktop and then tackle the mobile-specific parts on the devices you intend to support. Device emulation can make this process more straightforward.
The DevTools support for device emulation includes native User Agent and dimension overriding. This allows developers to debug mobile browsers on different devices and operating systems via the overrides Menu.

Now you can emulate the exact device metrics of devices like the Galaxy Nexus and the iPhone to test your media query-driven design.
More: DevTools Mobile Emulation | DevTools Docs
Emulating Geolocation
When working with HTML5 geolocation support in an application, it can be useful to debug the output received when using different values for longitude and latitude.
The DevTools support both overriding position values for navigator.geolocation and simulating geolocation not being available via the overrides menu.
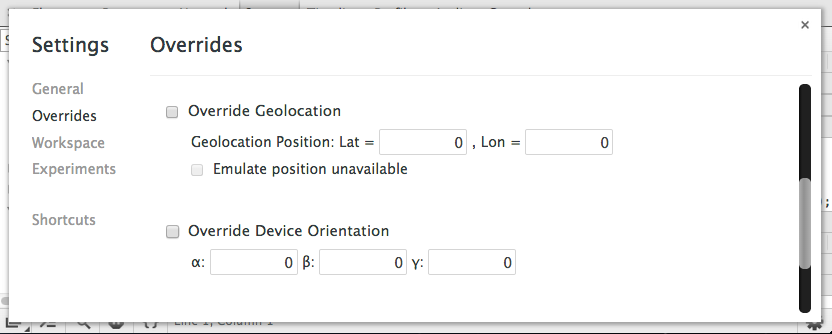
Overriding geolocation positions
Navigate to the Geolocation demo
Allow the page access to your position. This should hopefully be accurate.
Open up the overrides menu in the DevTools
Check “Override Geolocation” then enter in Lat = 41.4949819 and Lat = -0.1461206

- Refresh the page. The demo will now use your overridden positions for geolocation

Now check the “Emulate position unavailable” option
Refresh the page. The demo will now inform you that finding your location failed

More: DevTools Mobile Emulation | DevTools Docs
Dock-to-right for viewport debugging
Dock-to-right mode is also useful for previewing how your pages look when viewed on screens with smaller viewports. To use this:

Disable JavaScript
Click the Settings cog in the lower-right corner, then under Settings -> General enable “Disable JavaScript”. While the DevTools are open and this option is checked JavaScript will be disabled in the current page.

Should you require it, you can also run Chrome with the “-disable-javascript” flag to achieve the same effect.
General
Quickly switch between tabs
The Cmd + ] and Cmd + [ (or Ctrl + ] and Ctrl + [) shortcuts allow you to move right and left between the different tabs within the DevTools with ease. Use them to avoid manually selecting the tab you’re after!.

Get an improved dock-to-right experience
Improved horizontal splitting for the Elements and Sources panels are now in Chrome beta and can be experienced anytime you toggle dock-to-right mode:

However, if you have a very wide screen and would like to disable this, simply uncheck the “Split panels vertically when docked to right” option in the Settings panel.
![]()
More: 3 Steps To A Better Dock-To-Right Experience | G+
Use ‘Disable Cache’ for cache invalidation
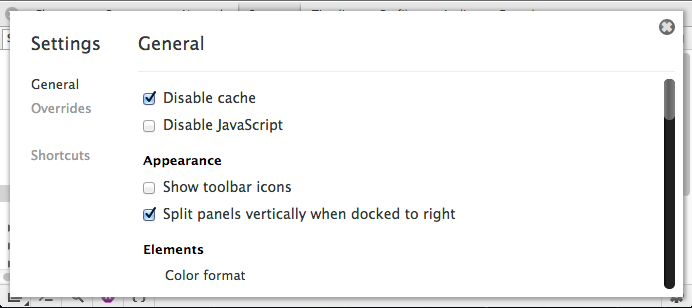
Under the Settings cog, you can enable ‘Disable cache’ to invalidate the disk cache. This is great for developing, but the DevTools must be visible/open for this to work.
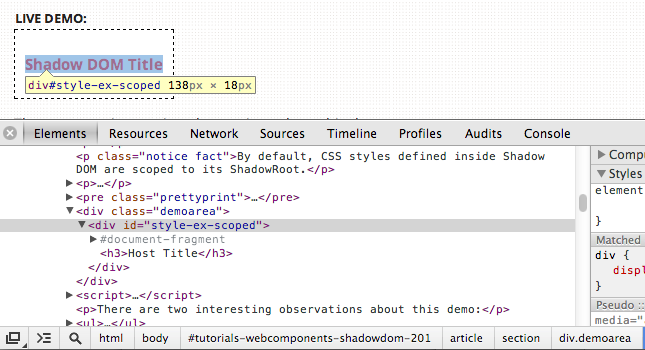
Inspect Shadow DOM
Elements which have Shadow DOM elements will now be displayed in the elements tab.
Enable the ‘Show Shadow DOM’ checkbox in Settings
Restart the DevTools

You can now peek inside Shadow DOM. For example, you can poke around the Shadow DOM Title demo on HTML5 Rocks:
Preview all inspectable pages
If you find yourself regularly using remote debugging, you might enjoy “about:inspect” which displays all inspectable tabs/extensions in Chrome. Click 'inspect' to switch to a page & launch the DevTools for it in one go.

Get insights into which sites have appcache'd
You can see information about appcached sites by visiting “about:appcache-internals”. This allows you to see which sites have appcached, when they were last modified, and how much space they're using. You can also remove appcaches here.

Select multiple filters in the Network/Console panels
You’re probably aware that there are filters available in the Network and Console panels, allowing you to narrow down the data displays based on different criteria.
What you probably don’t know is that you can use a shortcut (Cmd / Ctrl + click) to select more than one filter to be applied to view. Below you can see this in action across both panels.


Clear the cache and perform a hard reload
If you require a hard refresh, click and hold Chrome’s refresh button with the DevTools open. You should see a drop-down menu allowing you to clear the cache and do a hard reload in one go. Time saver!.
Note: This is currently only available on Windows and ChromeOS

Insights with the Chrome Task Manager
The task manager in Chrome can give you useful insights into the GPU, CPU and JavaScript memory usage, CSS and Script cache usage and more for any tab.
Follow these steps to open the task manager:
Click the Chrome menu on the browser toolbar.
Select Tools.
Select Task manager.
From there you can either select additional views to drill down to by right-clicking on any column or end a process by right-clicking on it.
Additional Tools
Debugging iOS apps in DevTools
PonyDebugger is a client library and gateway server combination that uses Chrome Developer Tools on your browser to debug your application's network traffic and managed object contexts.

JSRunTime: DevTools Extension For Grepping JavaScript Objects
Andrei Kashcha wrote a very useful extension for DevTools that can grep a reachable graph of JavaScript objects in memory and find matches by their value or name.
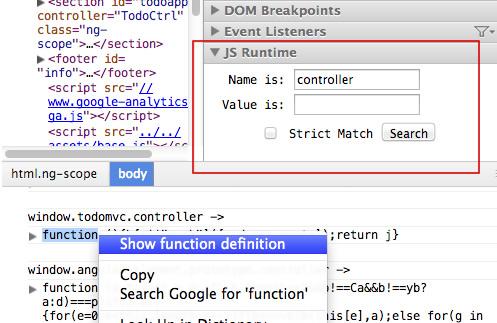
More: JSRuntime - A DevTools Extension For Grepping Objects | G+.
Other Resources
In addition to the tips above, there are also a number of fantastic external resources, slides, articles and videos that discuss the lesser known capabilities of the DevTools. We recommend looking at:


