Remote Debugging Chrome on Android
Note: For information on the interaction protocol we use for our remote debugging, please see the Debugger Protocol documentation and chrome.debugger.
Remote debugging
The experience of your web content on mobile operates very differently than what users experience on the desktop. The Google Chrome DevTools allow you to inspect, debug, and analyze the on-device experience with the full suite of tools you're used to, meaning you can use the Chrome DevTools on your development machine to debug a page on your mobile device.
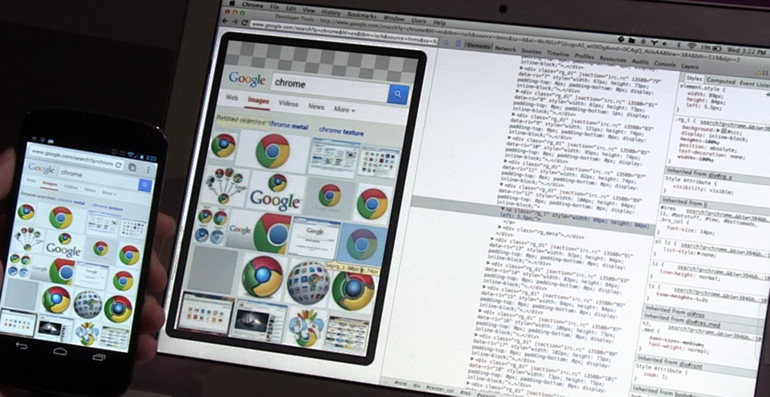
Debugging occurs over USB and as long as your mobile device is connected to your development machine, you can view and change HTML, scripts and styles until you get a bug-free page that behaves perfectly on all devices.
To begin remote debugging, you will need:
When debugging a web application served from your development machine, you can also use reverse port forwarding to allow the mobile device to access a site from the development machine over USB.
1. Setting up your device
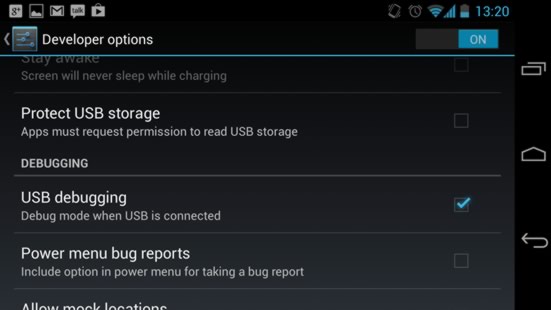
In order to debug over USB, you need to setup your Android device for development.
To enable USB debugging:
If you are developing on Windows, you need to install the appropriate USB driver for your device. See OEM USB Drivers on the Android Developers site.
2.1 Connecting directly over USB
Chrome Beta (M32)
As of Chrome Beta, the DevTools now support native USB debugging of connected devices. You no longer need to configure ADB or the ADB plugin to see all instances of Chrome and the Chrome-powered WebView on devices connected to your system.
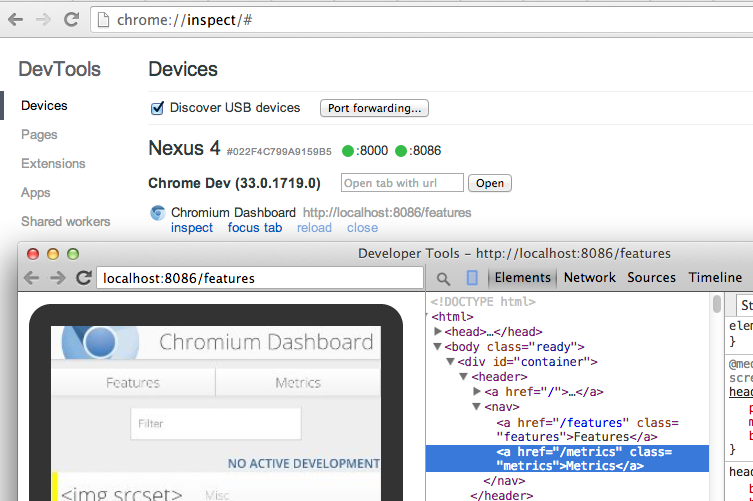
Just visit about:inspect and verify Discover USB Devices is checked.
Note: This update applies to both desktop Chrome Beta on Mac as well as ChromeOS. Windows users will need to install device drivers to enable communication between their devices.
Note: This direct USB connection between Chrome and the device may interrupt an `adb` connection that you may be trying to establish. If you need to use the `adb` binary for other reasons, uncheck the "Discover USB Devices" checkbox, unplug the device, and plug it back in, before checking `adb devices`.
Chrome m31 and earlier
Older versions of Chrome will still require the ADB Chrome extension in order to remotely debug devices. For more information, read remote debugging with the ADB Chrome extension.
2.2 Connecting via the the ADB Chrome extension
If you are using a version of Chrome which doesn't yet support native USB debugging (Chrome 31 and earlier), the ADB Chrome extension can alternatively be used to simplify your remote debugging workflow
Install the ADB extension
The ADB extension includes the Android Debug Bridge (ADB), which lets you debug the device over USB from your development machine. The extension provides the following benefits:
When the ADB extension is installed, a gray Android menu icon appears beside the Chrome menu.
To start debugging:
Click the Android icon, then click Start ADB.
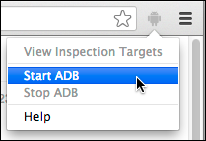
Once ADB has started, the menu icon turns green and displays the number of currently connected devices, if any.
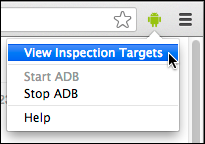
- Click View Inspection Targets to open the about:inspect page.
3. Connect your device
- Connect your mobile device to the development machine using a USB cable.
- When connecting your device to your development machine, you may see an alert on the device requesting permission for USB debugging from this computer. To avoid seeing this alert each time you debug, check Always allow from this computer and click OK
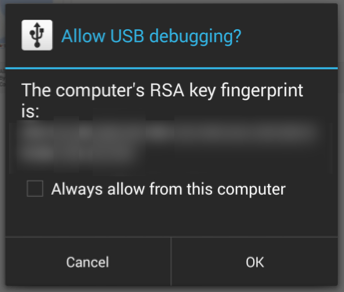
Now, to see all connected devices, go to the Chrome menu > Tools > Inspect Devices:
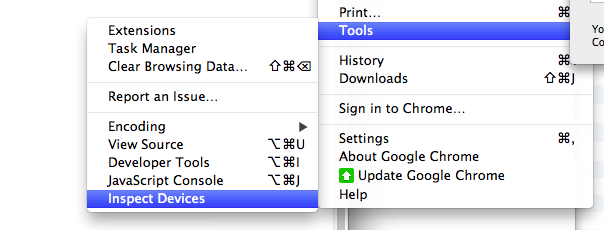
You can also navigate directly to about:inspect.
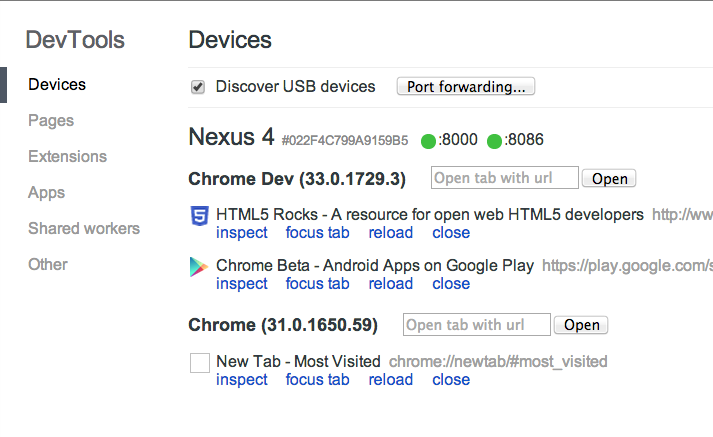
This page displays each connected device and its tabs. You can have multiple devices simultaneously connected as well as multiple versions of Chrome open on each device. As indicated lower on the page, debuggable WebViews appear here, as well.
Find the tab you're interested in and click the inspect link to open DevTools on it. You may also reload the page, bring it to the front, or close it. Lastly, you can open new links on the device through a text input field.
Troubleshooting
about:inspect doesn't show your device check that Discover USB devices is checked. If so, unplug the device and try revoking all USB authorizations in Developer Options to retry.4. Debug Your Application
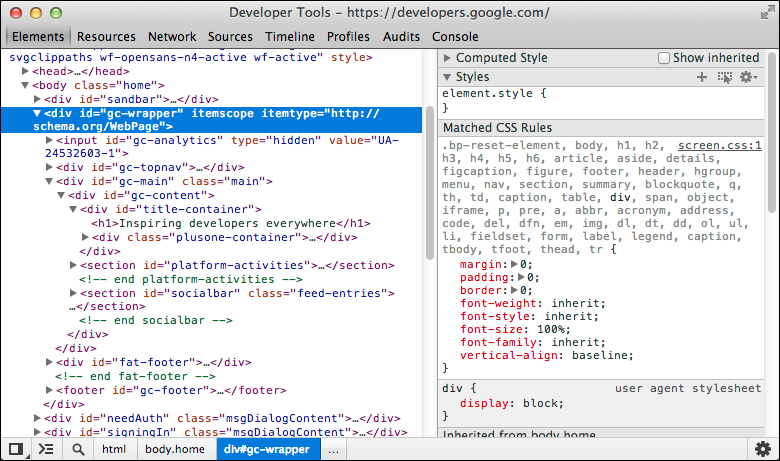
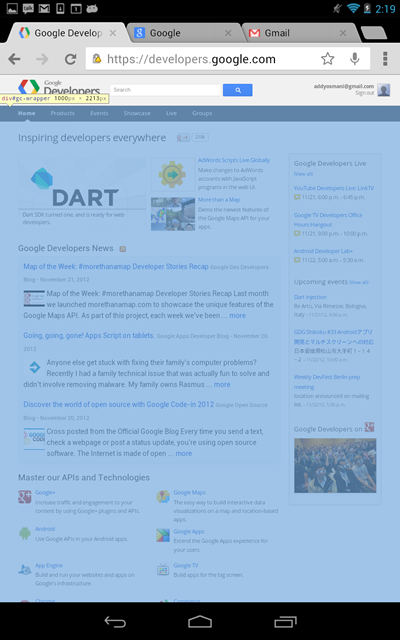
For example, inspect an element in the page you have selected and the element highlights in Chrome mobile on your device in real time.
Similarly, editing scripts or executing commands from the DevTools console affects the page being inspected on your device. You can also also use all of the other panels, such as Timeline and Profiles.
Notes
Screencasting your device's screen
Screencasting lets you bring the experience of your device onto your machine. This allows you to keep your attention on one screen instead of switching back and forth between the device and the DevTools. Currently, you need the Chrome for Android Beta (m32) for this feature.
Clicking on the screencast icon  in the toolbar opens up a panel on your computer displaying your device's screen. As you navigate, click, scroll, the screencast display will provide a live view of what's on your device.
While you are screencasting your device, can you control the mobile browsers's back and forward buttons, reload, and change the URL directly.

Interacting with the screencast
You can interact with the screencast of your device in a number of ways.
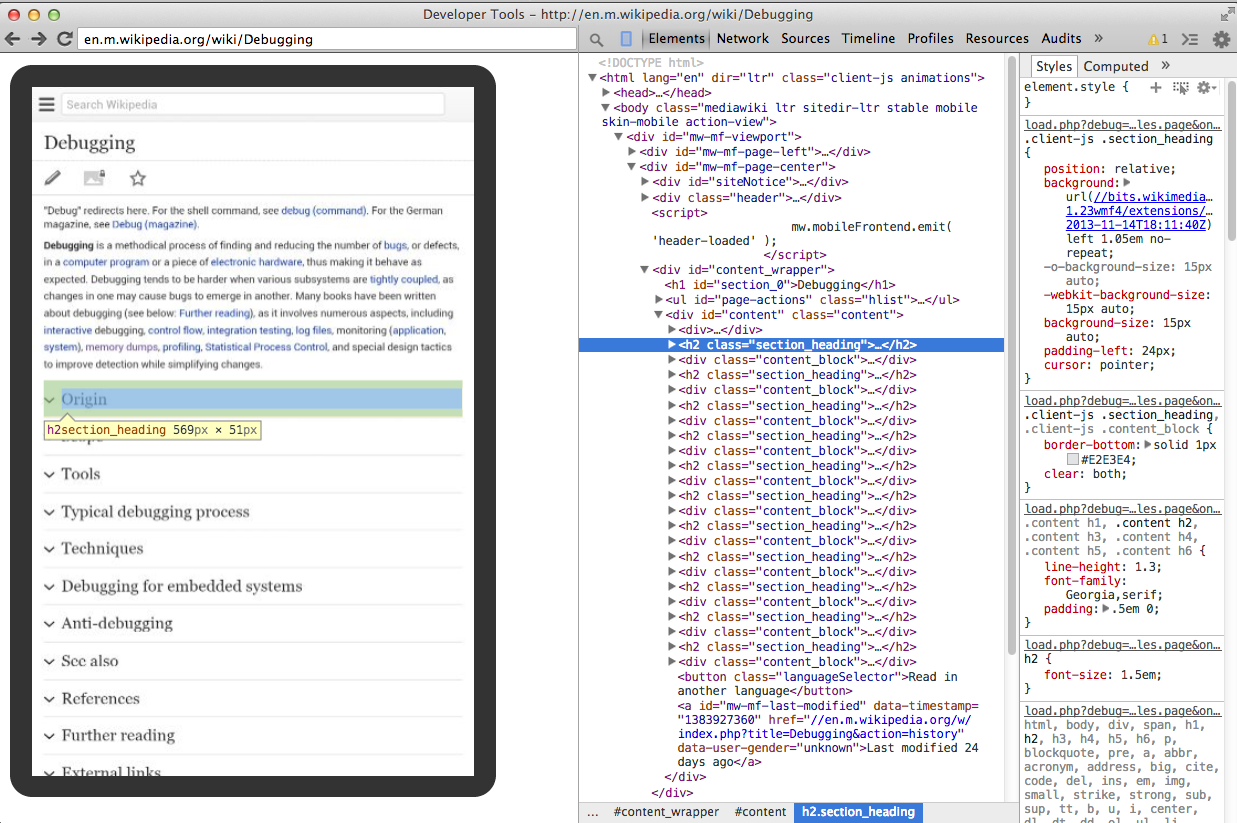
Note: The screencast feature repeatedly snaps screenshots on the device to give you the live view, but this does have a performance overhead. Disable screencast if you're testing framerate-sensitive situations.
Debugging Android WebViews
Starting Android 4.4 (KitKat), you can use the DevTools to debug the contents of Android WebViews inside native Android applications. Debugging WebViews requires:
Configure WebViews for debugging
The Enable USB web debugging setting in Chrome doesn't affect WebViews. To
debug the contents of your WebView, you need to enable it programmatically from within your application by calling
setWebContentsDebuggingEnabled, a static method on the WebView class.
if(Build.VERSION.SDK_INT >= Build.VERSION_CODES.KITKAT) {
    WebView.setWebContentsDebuggingEnabled(true);
}
This setting applies to all of the application's WebViews. Note that web debugging is not affected
by the state of the debuggable flag in the application's manifest. If you want to enable web debugging only
when debuggable is true, test the flag at runtime.
if(Build.VERSION.SDK_INT >= Build.VERSION_CODES.KITKAT) {
    if ( 0 != ( getApplcationInfo().flags &= ApplicationInfo.FLAG_DEBUGGABLE ) ) {
        WebView.setWebContentsDebuggingEnabled(true);
    }
}
Open a WebView in DevTools
To debug a WebView in DevTools:
Connect your mobile device to the development machine using a USB cable.
When connecting your device to your development machine, you may see an alert on the device requesting permission for USB debugging from this computer.
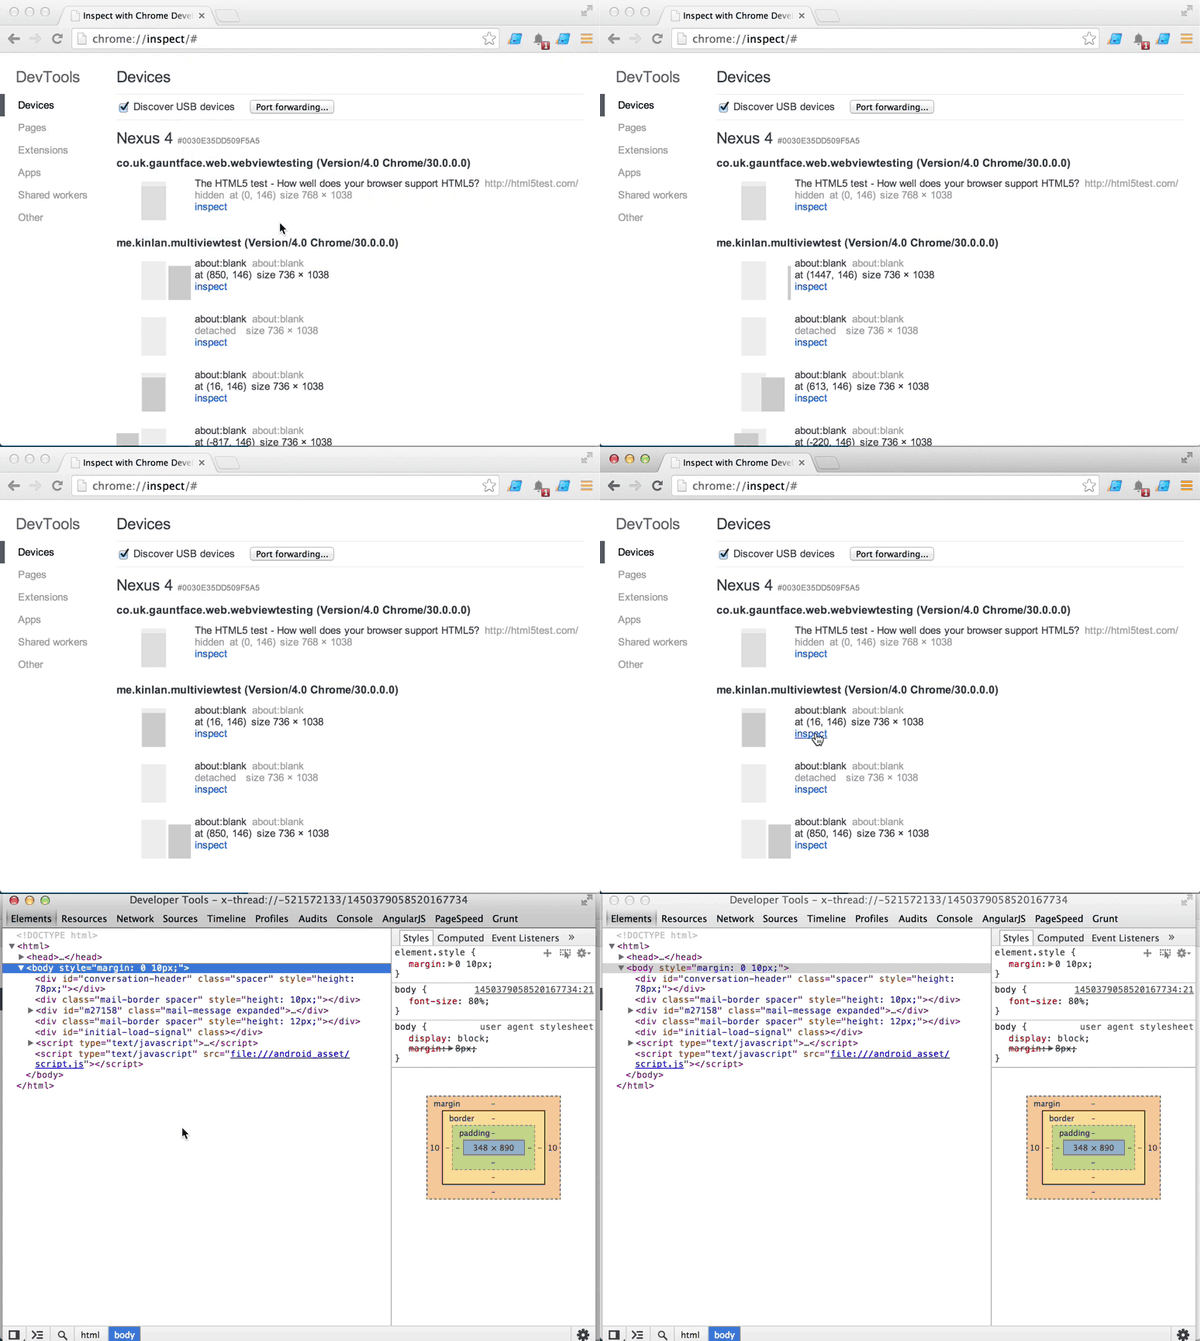
- In Chrome on your development machine, open about:inspect.
- You should see the name of your application and a list of debuggable WebViews. Click the
inspectlink next to one of the tabs to inspect the WebView's contents in DevTools.
To avoid seeing this alert each time you debug, check Always allow from this computer and click OK.
Port Forwarding
Commonly you have a web server running on your local development machine, and you want to connect to that site from your device. If the mobile device and the development machine are on the same network, this is straightforward. But this may be difficult in some cases, like on a restricted corporate network.
Chrome for Android supports port fowarding making this workflow very simple to do. It works by creating a listening TCP port on your mobile device that maps to a particular TCP port on your development machine. The traffic through the forwarded port travels over USB, so it doesn't depend on the mobile device's network configuration.
This procedure assumes that you already have remote debugging configured and working.
1. Connect your mobile device
- Connect your device to your development machine over USB.
- Stop all instances of Chrome currently running on the mobile device.
- Open Chrome for Android.
2. Enable port forwarding
Perform the following steps on Chrome on your development machine:- Open about:inspect. You should see your mobile device and a list of its open tabs.
- Click Port Forwarding button at the top.
- In the Device port field, enter the port number the Android should device listen on (defaults to 8080).
- In the Host field, add the IP and port number where your web application is running on localhost.
- Make sure to check Enable port forwarding before hitting Done.
3. Profit
On about:inspect you should now see a green circle indicating your port forwarding is succssful. Now, enter in your local URL into the Open tab field and hit Go to open it on your device's browser.
You should see the content being served by your development machine.
