Remote Debugging on Android (Legacy Workflow)
This document describes the legacy workflow for remotely debugging Chrome for Android.Overview
To start debugging, you need:
1. Install the Android SDK
The Android Developer Tools (ADT) bundle provides you with the Android SDK out of the box. Once you've downloaded the ADT, unzip it to a directory on your system (e.g "Downloads").
You will initially see two sub-directories in the extracted folder - eclipse and
sdk. To communicate with an Android device, you use the Android Debug Bridge (adb),
a command-line tool included in Platform Tools (<sdk>/platform-tools/).
For convenience, add Platform Tools to your PATH environment variable. If on Mac, run the following command from your terminal: export PATH=$PATH:/<path-to-SDK>/platform-tools/.
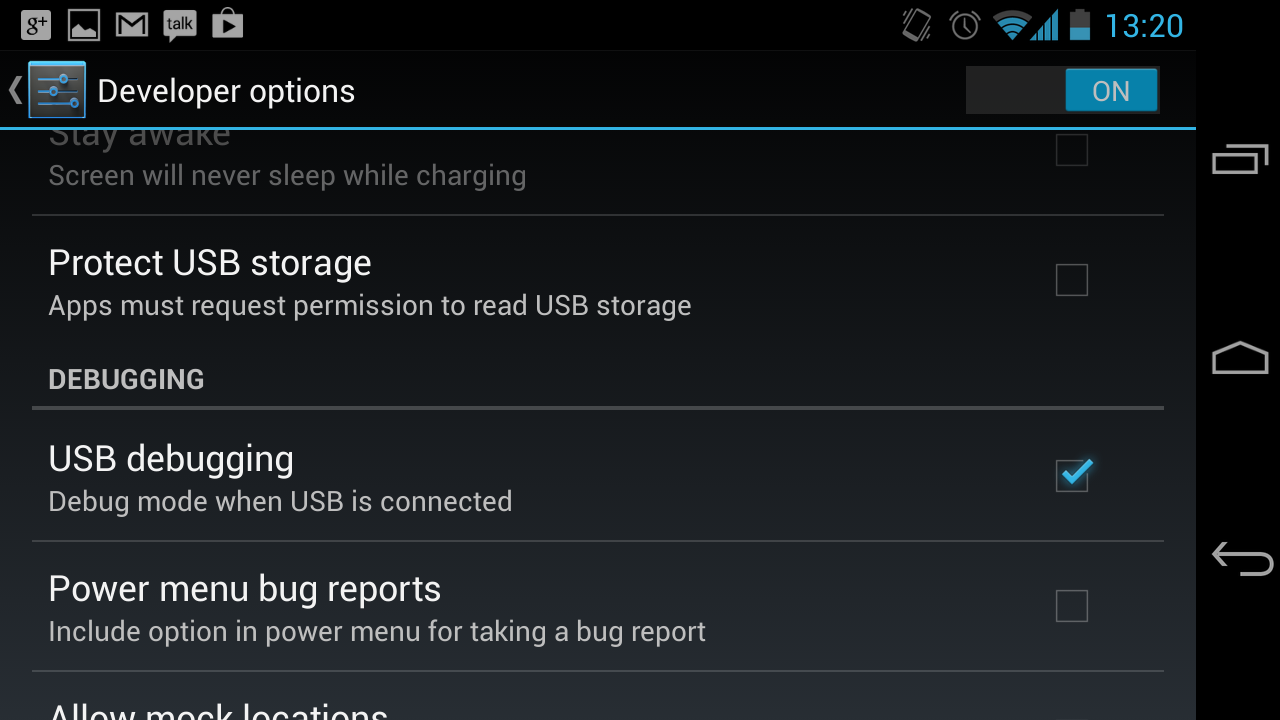
2. Enable USB debugging on your device
In order to debug over USB, you need to setup your Android device for development. Enable USB debugging on your device then system to detect your device as mentioned in the guide.
To enable USB debugging:

3. Connect your device via USB
- Connect your mobile device to the development machine using a USB cable.
- Ensure your device is listed as available by issuing the
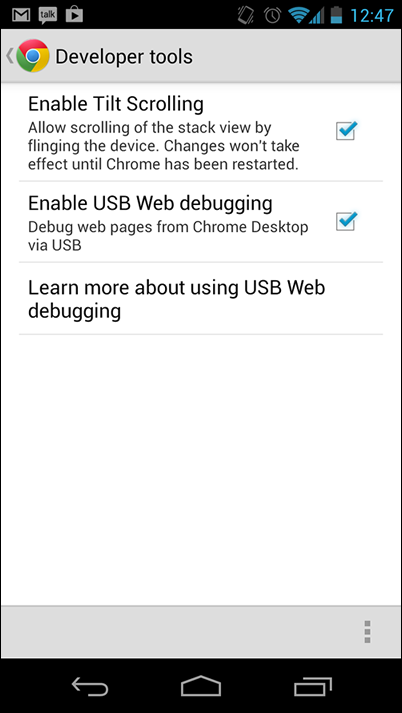
adb devicescommand. If not, please check that you have USB debugging enabled on your device. - On the mobile device, launch Chrome. Open Settings > Advanced > DevTools and check the Enable USB Web debugging option as shown here:
- Issue the following command in the terminal or console on your development machine
to enable port forwarding:
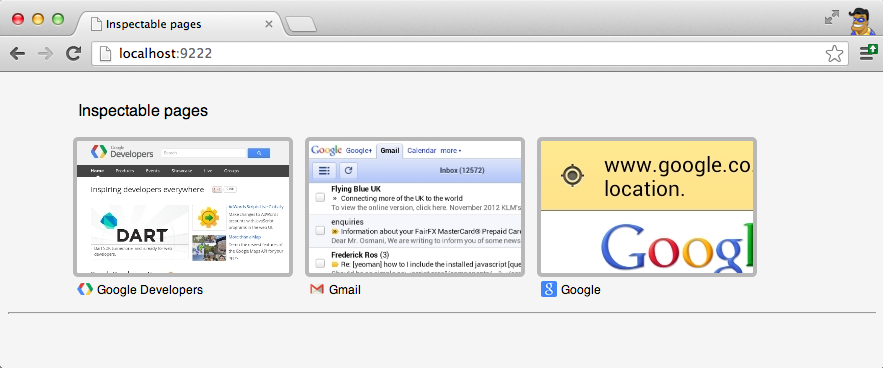
adb forward tcp:9222 localabstract:chrome_devtools_remote - On your development machine, open Chrome and navigate to
localhost:9222.
- You will be presented with the set of thumbnails for pages currently open in tabs on your mobile Chrome. Choose the page you would like to debug.
- You can now start debugging and profiling mobile content in the DevTools on your development machine.


Note: If you get a "device not found" error, run the adb kill-server command to
resolve.

See Debug your Application for tips on getting started debugging your mobile application.
