Authoring & development workflow
Developer workflow typically involves a number of steps used to achieve a goal. While authoring with the DevTools, it's possible to optimize this workflow to save time achieving common tasks, such as locating files or functions, persisting edits to scripts or stylesheets, saving commonly used snippets or simply rearranging the layout to better suit your needs.
In this section, we'll explore a number of tips to make your workflow in the DevTools more efficient.
Dock-To-Right For Vertical-Split Editing
You may find that docking the DevTools to the bottom of the window provides a lot of horizontal space, but less space vertically. Dock to right allows you to align the DevTools to the right-hand side of a window whilst keeping it attached. This enables you to inspect the current page on the left, whilst debugging on the right.
This is useful as:
Navigate to a URL you wish to debug then toggle between
dock-to-right and dock-to-window by clicking and long-holding on the
layout icon  at the bottom left-hand corner of the DevTools.
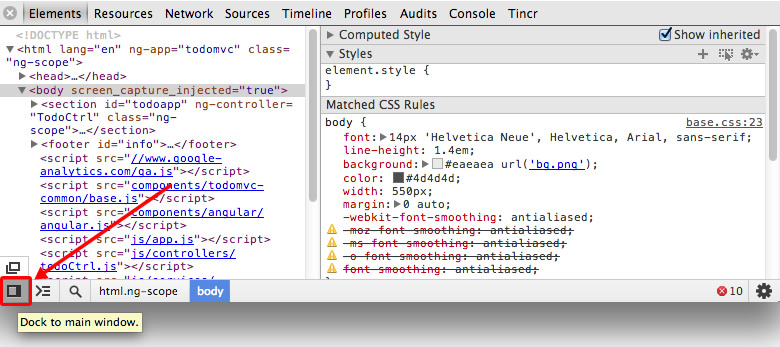
Note: The DevTools will remember your last choice, so you can go back and forth between the two most common options.
This will expand to display the available layout options. Once you've selected a preference, the layout will change immediately to reflect the change.
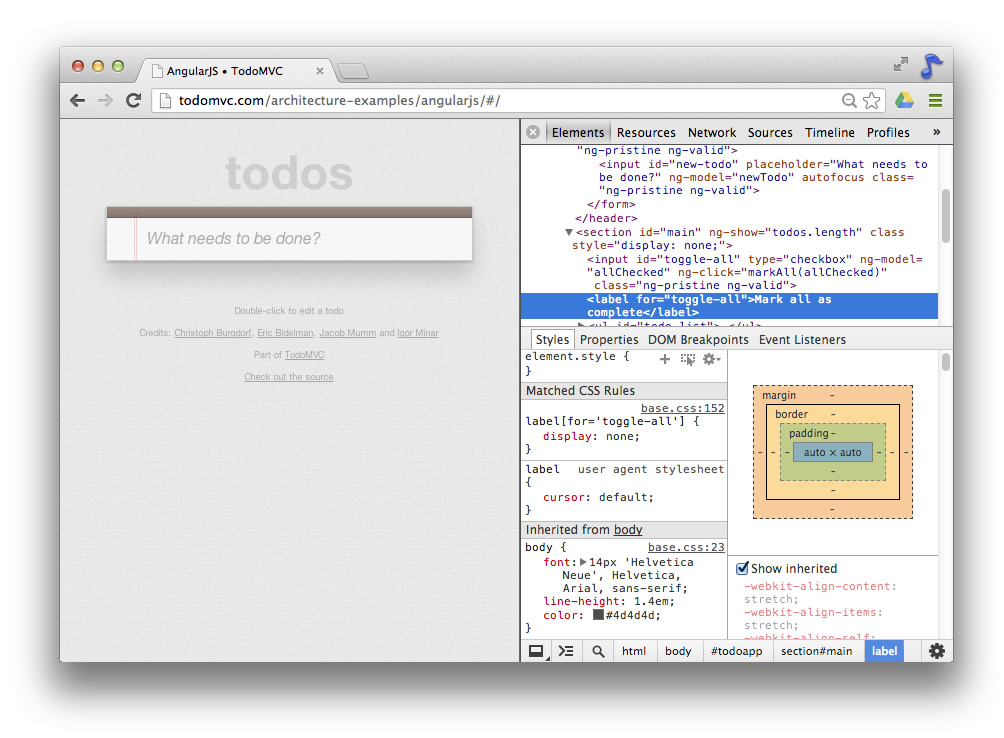
Note: Each tab can have it's own custom layout arrangement for the DevTools. This means it is possible to have one tab's Tools docked to right whilst another's is docked to the bottom of the window.
Drag-To-Right For Quicker Dock-Positioning
It is also possible to hold down and drag the DevTools toolbar to move its docking position, as demonstrated in the animation below.
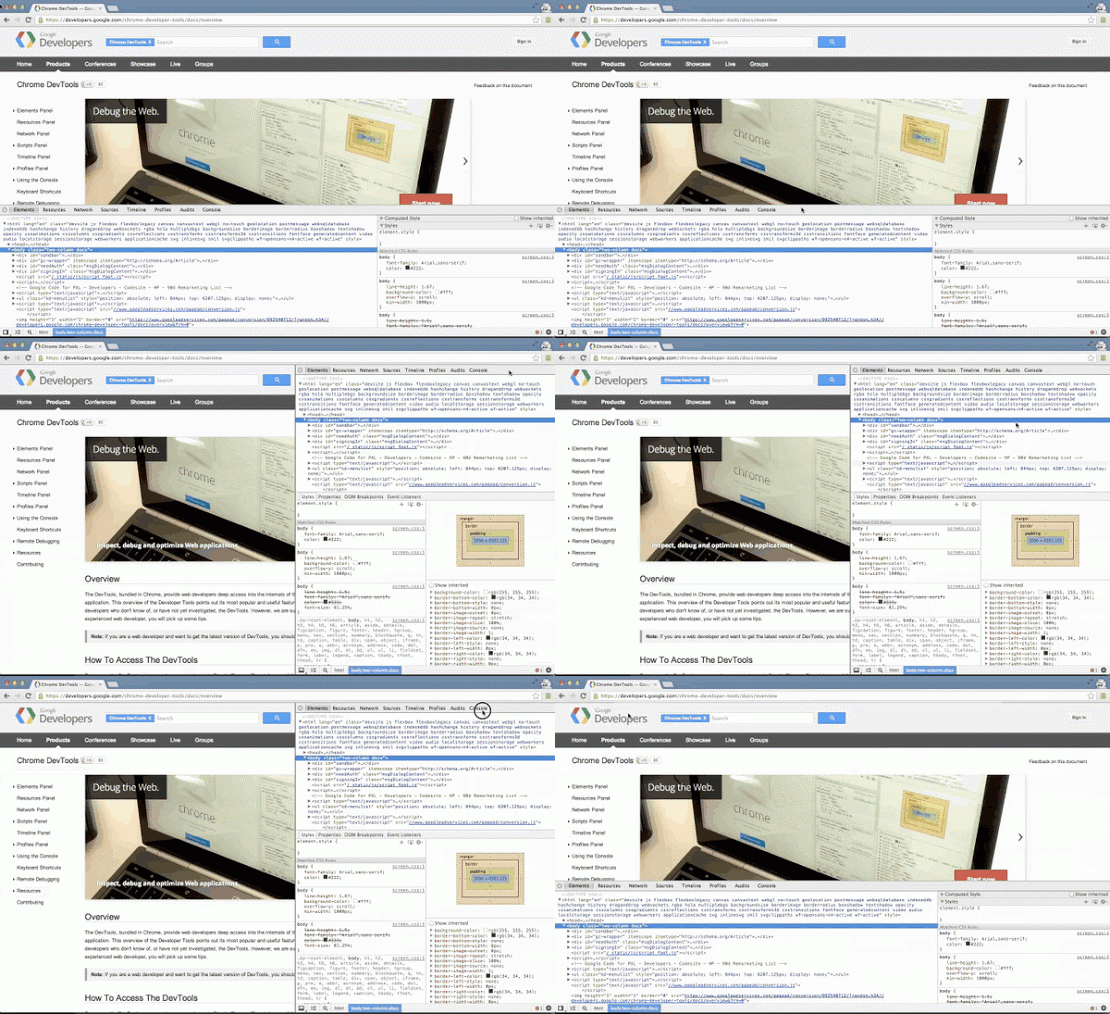
This can be a useful alternative to holding down the layout button to select your desired docking position as it only takes one step to toggle between dock-to-right and dock-to-window.
Search, Navigate And Filter
Filter For A Script, Stylesheet Or Snippet By Filename
The ability to quickly locate a specific file can be essential to a developer's workflow. The DevTools allow you to search across all script, stylesheet and snippet files using the following shortcuts:
which will work regardless of the panel you are currently in. For this Todo app, using one of these shortcuts will take us to the Sources panel and present us with a search box listing all inspectable files.

From there, we can filter down to specific files (e.g files with the word 'script' in their name) or select a file to view or edit.
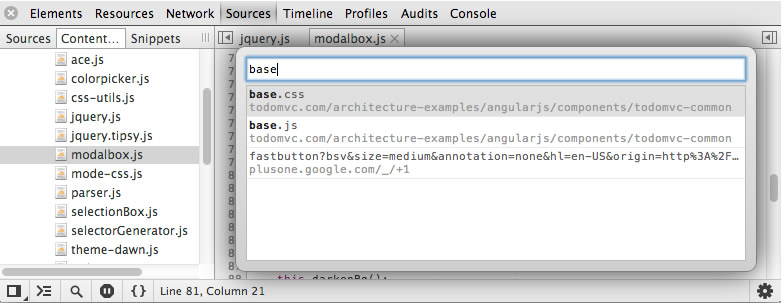
Note: We support camel-case matching in all of our dialogs. e.g: to open FooBarScript.js, you could just type FBaSc, which could save time.
Text Search Within The Current File
Searching for a specific string within the current file can be done using the following shortcut:
Once a keyword has been entered into the search field, hit return to move to the first matched result. Subsequent returns will take you to the next result and you can also move between results using the up and down arrow keys as displayed below.
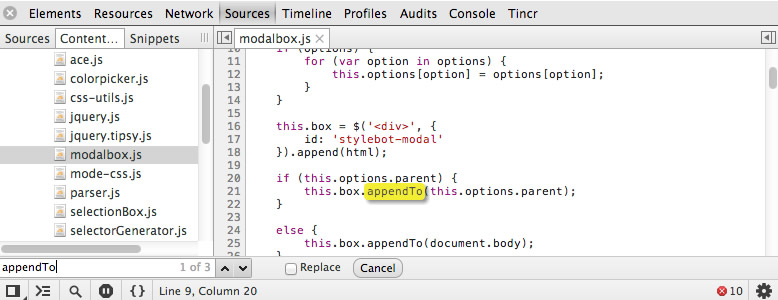
Replace Text Within The Current File
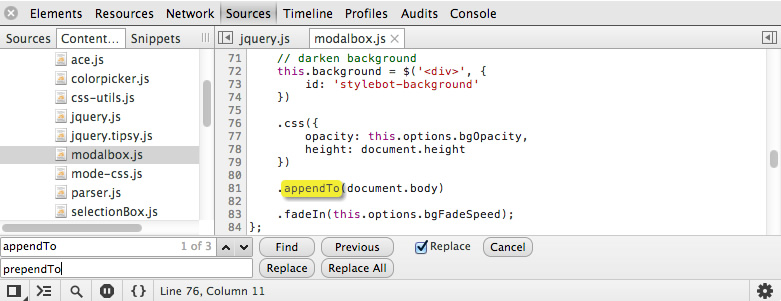
In addition to supporting locating text within the current file, the DevTools also support replacing both individual and all instances of text with a new value. Checking "Replace" will display a second input field allowing you to specify the replacement text.
Text Search Across All Files
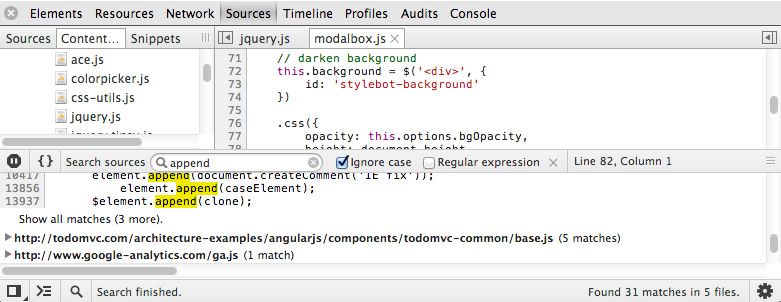
If you wish to search across all of the files loaded for a page for a particular string, you can load up the search pane using the following shortcut:
This supports both regular expressions and case sensitive search.
Search Using A Regular Expression
To search using a regular expression, simply type in the expression in the Search sources field, check "Regular expression" and hit return.
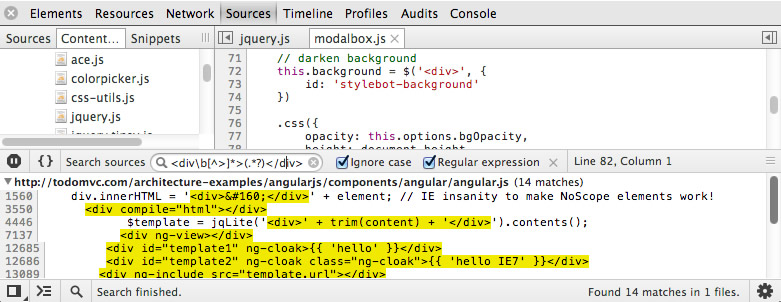
Above we can see an example of how this can be done to find all results matching
content within <div></div> tags.
Filter For A Function Or Selector Within A File
Should you require further granularity it is also possible to navigate to (or search for) specific JavaScript functions or CSS rules within a file.
Navigate to a page of your choosing then go to the Sources panel. You can now use the following shortcuts to bring up a function/selector-specific search box:

Depending on the type of file selected you will either see all of the available JavaScript functions or CSS declarations. Start typing in the name of a function or declaration to filter down the list of results or simply select a result be taken directly to where it is defined in the current file.
Jump To Line Number
The tools also support jumping to a specific line-number within the editor. To launch the line number dialog, simply select a file for editing then use one of the following keyboard shortcuts to display the line picker:
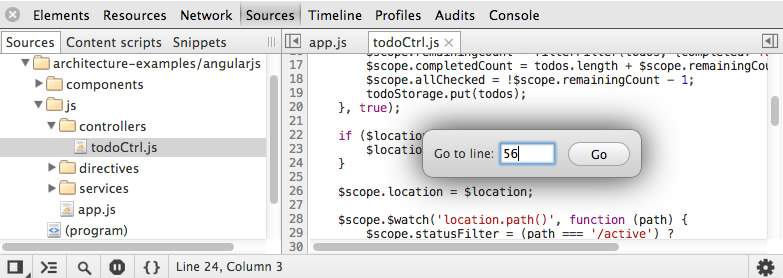
Live Editing Scripts & Styles
The DevTools support editing both styles and scripts live, without the need for a full page refresh. This helps when testing design changes, prototyping JavaScript functions or snippets.
Scripts
JavaScript can be directly edited in the DevTools via the Sources panel. To open up a specific script for editing, either:
1. Click the link to the script (e.g <script src="app.js"></script>) in the
markup view of the Elements panel:
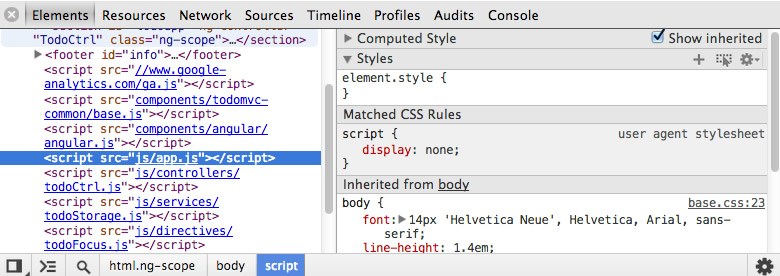
2. Or select the filename of the script from Sources sub-panel under Sources:
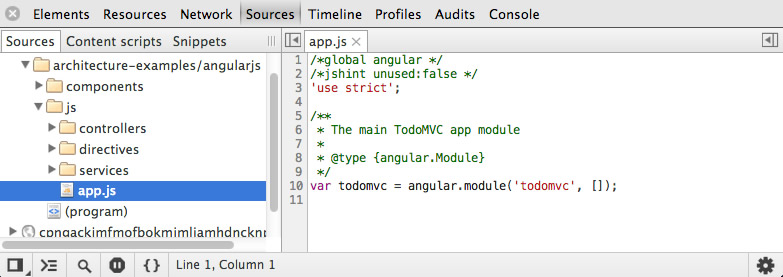
This will display the syntax-highlighted source to the file in a new tab to the right-hand side of the panel.
Changes to scripts are only executed at evaluation time, meaning that modifications to code that is not running after the page loads will not have an effect. Changes to code executed at a later stage, such as mouseover handlers or click-event callbacks can however be changed and tested on the fly.
For more information about debugging JavaScript in the Sources panel, read our related documentation on JavaScript Debugging.
Note: A Workspaces feature for persistent editing of local files is also available. Read more.
Styles
There is a similar workflow for editing styles. Open the DevTools and switch to the Elements panel. On the right-hand side, a number of sub-panels will be visible including Styles. Inspecting an element in the page will display the list of properties in Styles that have been applied to the current node, grouped by selector.
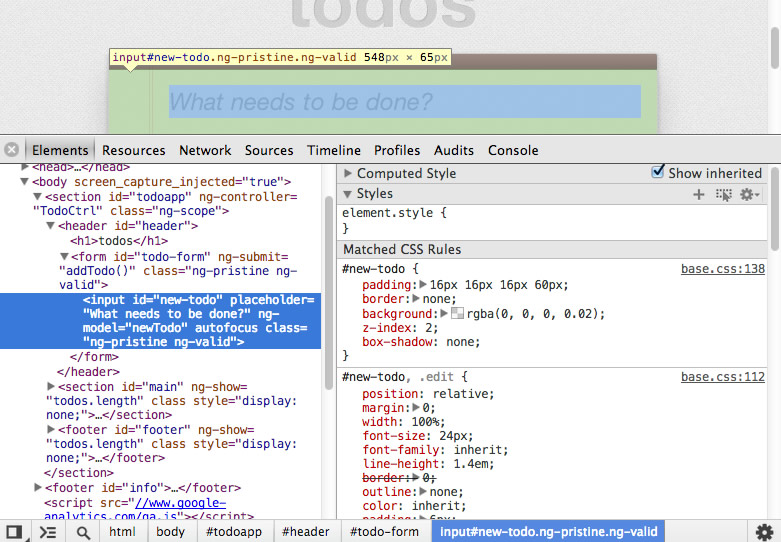
The "element.style" section displays properties that were set through the style attribute in the page's markup.
The next section is "Matched CSS Rules", which displays the selectors matching the selected node, their properties and values as well as the filename the rule originated from and the line number it was read from. The selector that matches the node will be colored black whilst the others will be gray. This is of great benefit as it makes the selectors more easily separable while reading.
Changing any CSS property in one of the sub-panels, such as the border or dimensions for an element, will result in the change being instantly applied and visible in the main browser window.
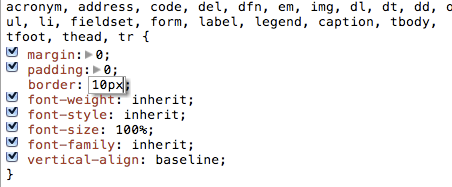

Going back to the "Matched CSS Rules" panel, clicking on the link to the stylesheet next to a rule will also take you to the Sources panel. The will display the complete stylesheet and take you to the line number where the relevant CSS rule exists.

From here, you can make changes to the file in the same way you would a regular text editor, except changes you make are displayed in real time.
Save As
Once you are happy with the changes made to your files, you can save them.
To do this, first make sure you are in the text editor view for the file you modified by either locating the file manually in the left-hand sidebar under the Sources tab:
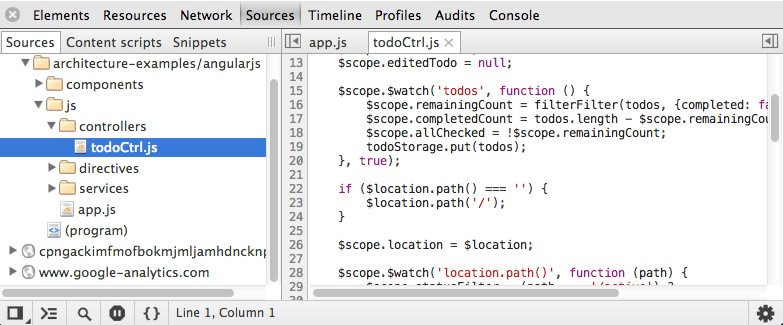
or clicking on the filename (e.g styles.css) in the "Elements -> Styles panel" (for SASS/CSS):

Next, right-click on either the filename or inside the text editor and click "Save As". This will bring up a context menu allowing you to overwrite your existing file.
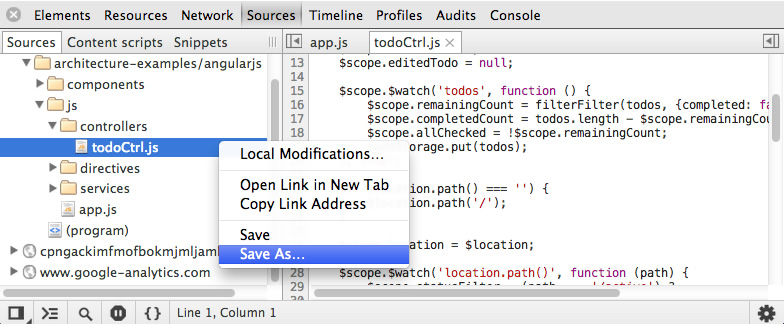
Subsequent saves (using Save from the same menu or the Ctrl/Cmd + S shortcut) will save to the same location.
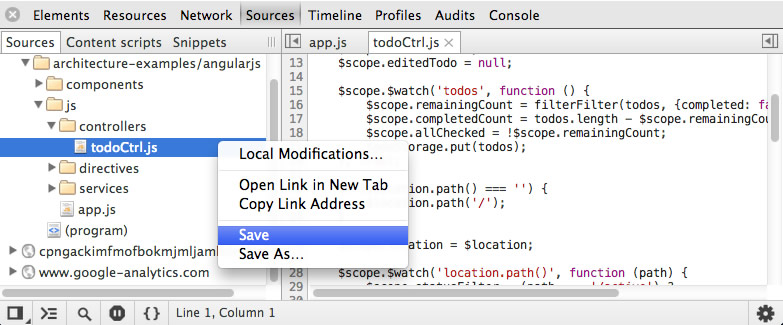
Local Modifications
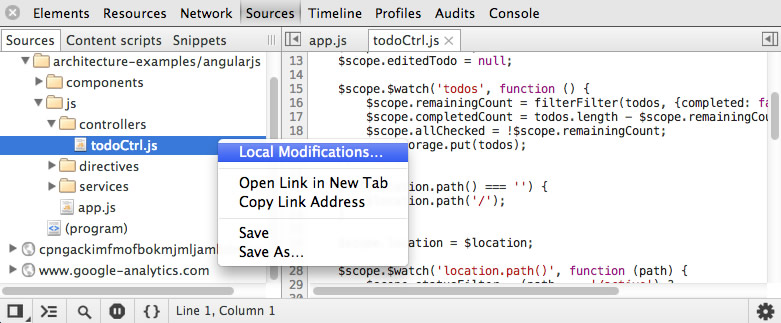
The DevTools also maintains a revision history of all changes made to local files. If you've edited a script or stylesheet and saved changes using the Tools, you can right-click on a filename in Sources (or within the source area) and select "Local modifications" to view this history.
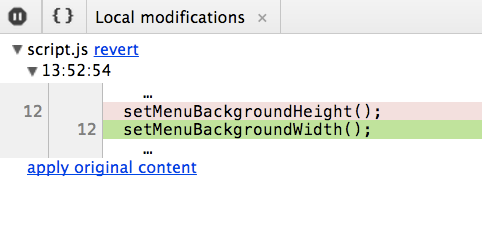
A Local modifications panel will appear displaying:
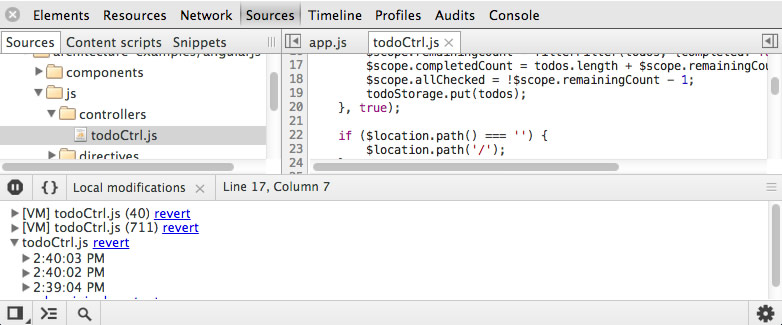
in addition to a number of links. The revert link will revert all of the changes made to the file back to its original state, removing the revision history.
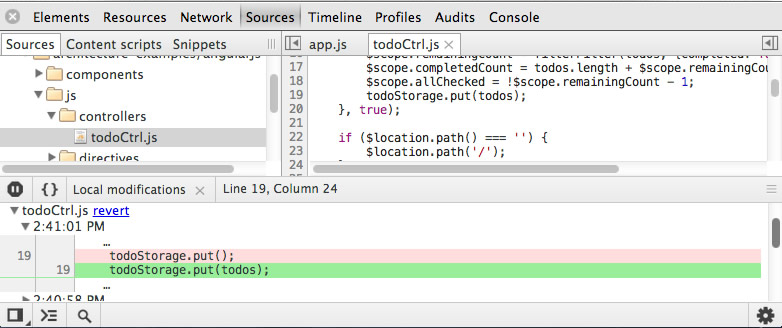
Apply original content will effectively do the same action, but will maintain the revision history in view in case you wish to go back to a specific changeset.

Finally, apply revision content will apply the changes for a specific revision at a set time.
Custom JavaScript Snippets
Sometimes you want to be able to save smaller scripts, bookmarklets and utilities so that you’ve always got them available to you while debugging in the browser. Snippets is a new DevTools feature enabling this workflow, allowing you to create, store and run JavaScript within the Sources tab. It is currently available in Chrome Canary.
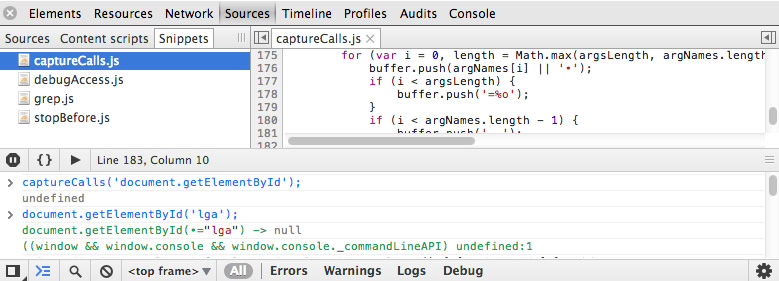
Some of the use-cases Snippets can help with are:
Getting Started
To get started with Snippets, navigate to the Sources tab. If you haven't been doing any other work in this tab, you will be presented with the default layout shown below.
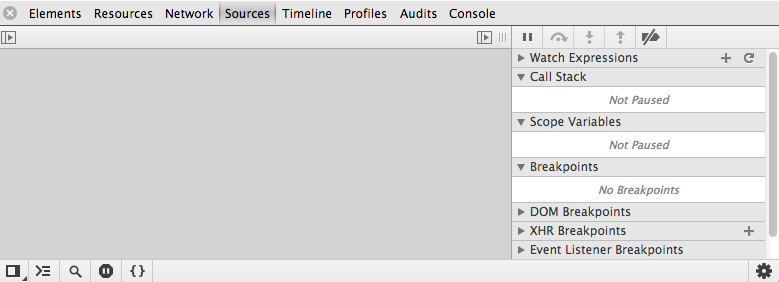
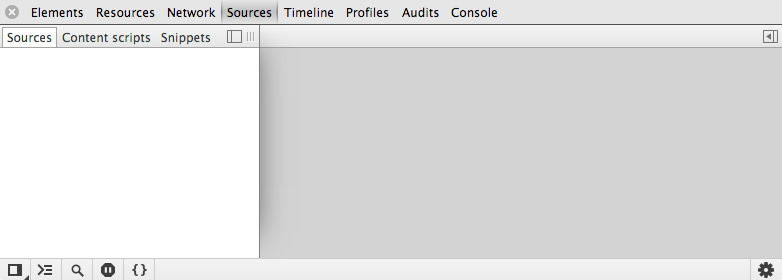
Click the layout toggle in the top left-hand corner to display extended panels. Here you should now see Sources, Content scripts and a new tab, Snippets. Click on it to go into Snippets.
Creating Snippets
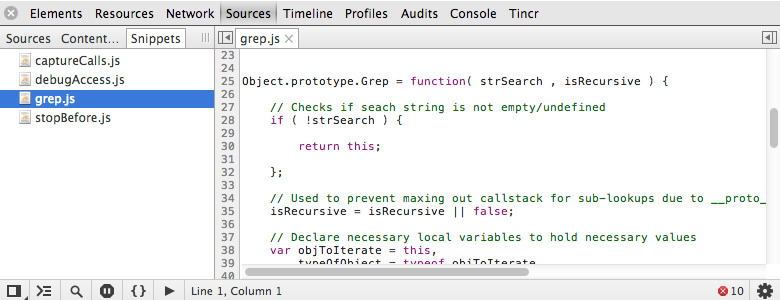
Snippets work across two panels. The panel to the left (similar to Sources) is the file-list, whilst selecting a snippet file will open it in the editor to your right. This is a very similar experience to selecting a script or stylesheet for editing in the Sources tab.
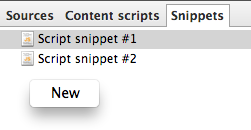
A new snippet file can be created by right-clicking inside the file-list and selecting "New".
Snippet Filenames
Snippet filenames are automatically generated, but you also have the option of customizing these filenames as soon as your snippet has been created.
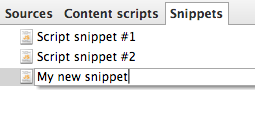
Should you wish to rename the file at any time after this, simply right-click it again in the file-list and select 'Rename'. You can also 'Remove' the snippet should you need to.
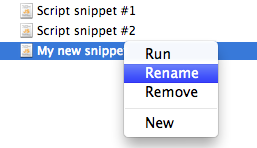
Editing And Executing Snippets
Selecting a snippet file from the file-list opens it up in the built-in editor to your right. Here you can write or paste any JavaScript code (i.e your snippet) including functions and expressions.

If a filename is preceded by a *, this means that the snippet is modified and not yet saved.
To run a snippet, right-click on it's filename in the file-list and select "Run". Alternatively, you can hit the Run (>) button.
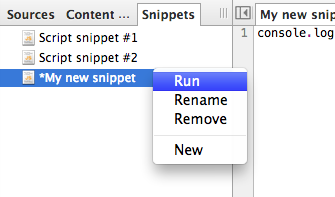
If the snippet is expected to have any console output, this will be displayed in the console below the editor.
Note: A keyboard shortcut is also available for easily executing a snippet - just select your snippet then use Ctrl/Cmd + Enter to run it. This replicates the behavior of the Run (>) button - currently in the Sources console, but which will be moving into the debugger control in the near future.
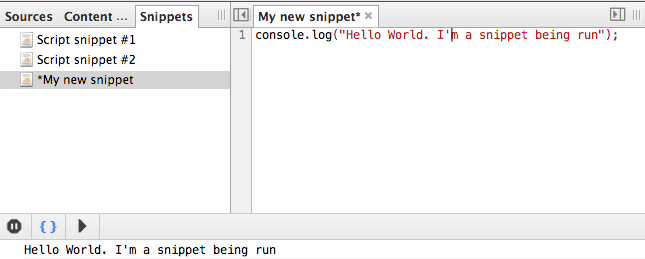
If you instead wish to evaluate specific lines of your snippet in the console, you can simply select these within the editor, right-click over your selection and choose the "Evaluate in Console" option to execute. The keyboard shortcut for this is: Ctrl + Shift + E.
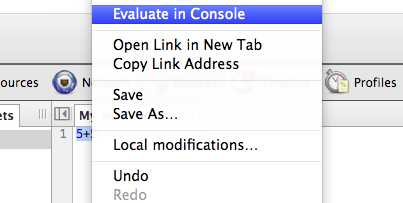
As with "Run", output of the expression can be viewed in the console below the editor.

Local Modifications
As per Sources, Snippets also support viewing local modifications made to files with the ability to revert back to specific edit points in a revision history.
Right-clicking within the editor window and selecting "Local modifications..." after saving any changes locally will provide access to this functionality.
Breakpoints, Watch Expressions And More
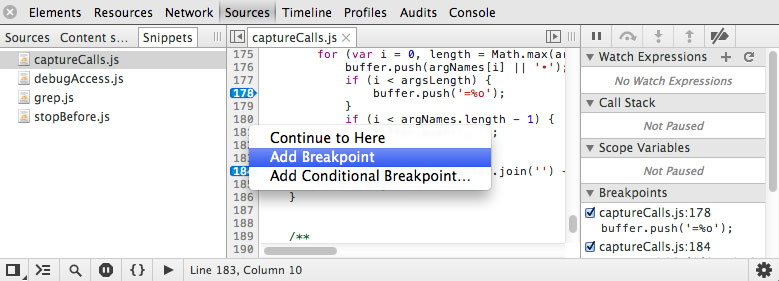
Other features you're used to in the Sources panel, such as adding watch expressions, breakpoints, scoping variables and saving files are also available for use with Snippets.
Read the relevant documentation on the Sources panel for further information about how these features may be used.
Saving Snippets
Snippets can either be saved and later accessed via the Snippets tab in the DevTools or exported to a new file on your system. To display save options for a Snippet, right-click within the text editor to display the editor menu.
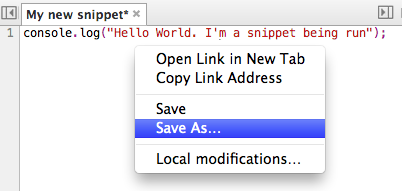
Save will persist changes to your existing snippet file, whilst Save As will allow you to save the snippet to a new file in a location of your choice.
Note: Snippets are stored in the DevTools localStorage. When performing a Save/Save As, you can bind the snippet to the file where it should be saved like any other script.
Navigating Snippets
Similar to scripts and stylesheets in Sources, Snippets also supports navigating to specific snippet files, functions or line-numbers using the same keyboard shortcuts we mentioned earlier.

