- Cover
- Acknowledgments
- 1 Preface
- 2 (R)e-Introduction to statistics
- 2.1 Histograms, boxplots, and density curves
- 2.2 Pirate-plots
- 2.3 Models, hypotheses, and permutations for the two sample mean situation
- 2.4 Permutation testing for the two sample mean situation
- 2.5 Hypothesis testing (general)
- 2.6 Connecting randomization (nonparametric) and parametric tests
- 2.7 Second example of permutation tests
- 2.8 Reproducibility Crisis: Moving beyond p < 0.05, publication bias, and multiple testing issues
- 2.9 Confidence intervals and bootstrapping
- 2.10 Bootstrap confidence intervals for difference in GPAs
- 2.11 Chapter summary
- 2.12 Summary of important R code
- 2.13 Practice problems
- 3 One-Way ANOVA
- 3.1 Situation
- 3.2 Linear model for One-Way ANOVA (cell-means and reference-coding)
- 3.3 One-Way ANOVA Sums of Squares, Mean Squares, and F-test
- 3.4 ANOVA model diagnostics including QQ-plots
- 3.5 Guinea pig tooth growth One-Way ANOVA example
- 3.6 Multiple (pair-wise) comparisons using Tukey’s HSD and the compact letter display
- 3.7 Pair-wise comparisons for the Overtake data
- 3.8 Chapter summary
- 3.9 Summary of important R code
- 3.10 Practice problems
- 4 Two-Way ANOVA
- 4.1 Situation
- 4.2 Designing a two-way experiment and visualizing results
- 4.3 Two-Way ANOVA models and hypothesis tests
- 4.4 Guinea pig tooth growth analysis with Two-Way ANOVA
- 4.5 Observational study example: The Psychology of Debt
- 4.6 Pushing Two-Way ANOVA to the limit: Un-replicated designs and Estimability
- 4.7 Chapter summary
- 4.8 Summary of important R code
- 4.9 Practice problems
- 5 Chi-square tests
- 5.1 Situation, contingency tables, and tableplots
- 5.2 Homogeneity test hypotheses
- 5.3 Independence test hypotheses
- 5.4 Models for R by C tables
- 5.5 Permutation tests for the \(X^2\) statistic
- 5.6 Chi-square distribution for the \(X^2\) statistic
- 5.7 Examining residuals for the source of differences
- 5.8 General protocol for \(X^2\) tests
- 5.9 Political party and voting results: Complete analysis
- 5.10 Is cheating and lying related in students?
- 5.11 Analyzing a stratified random sample of California schools
- 5.12 Chapter summary
- 5.13 Summary of important R commands
- 5.14 Practice problems
- 6 Correlation and Simple Linear Regression
- 6.1 Relationships between two quantitative variables
- 6.2 Estimating the correlation coefficient
- 6.3 Relationships between variables by groups
- 6.4 Inference for the correlation coefficient
- 6.5 Are tree diameters related to tree heights?
- 6.6 Describing relationships with a regression model
- 6.7 Least Squares Estimation
- 6.8 Measuring the strength of regressions: R2
- 6.9 Outliers: leverage and influence
- 6.10 Residual diagnostics – setting the stage for inference
- 6.11 Old Faithful discharge and waiting times
- 6.12 Chapter summary
- 6.13 Summary of important R code
- 6.14 Practice problems
- 7 Simple linear regression inference
- 7.1 Model
- 7.2 Confidence interval and hypothesis tests for the slope and intercept
- 7.3 Bozeman temperature trend
- 7.4 Randomization-based inferences for the slope coefficient
- 7.5 Transformations part I: Linearizing relationships
- 7.6 Transformations part II: Impacts on SLR interpretations: log(y), log(x), & both log(y) & log(x)
- 7.7 Confidence interval for the mean and prediction intervals for a new observation
- 7.8 Chapter summary
- 7.9 Summary of important R code
- 7.10 Practice problems
- 8 Multiple linear regression
- 8.1 Going from SLR to MLR
- 8.2 Validity conditions in MLR
- 8.3 Interpretation of MLR terms
- 8.4 Comparing multiple regression models
- 8.5 General recommendations for MLR interpretations and VIFs
- 8.6 MLR inference: Parameter inferences using the t-distribution
- 8.7 Overall F-test in multiple linear regression
- 8.8 Case study: First year college GPA and SATs
- 8.9 Different intercepts for different groups: MLR with indicator variables
- 8.10 Additive MLR with more than two groups: Headache example
- 8.11 Different slopes and different intercepts
- 8.12 F-tests for MLR models with quantitative and categorical variables and interactions
- 8.13 AICs for model selection
- 8.14 Case study: Forced expiratory volume model selection using AICs
- 8.15 Chapter summary
- 8.16 Summary of important R code
- 8.17 Practice problems
- 9 Case studies
- 9.1 Overview of material covered
- 9.2 The impact of simulated chronic nitrogen deposition on the biomass and N2-fixation activity of two boreal feather moss–cyanobacteria associations
- 9.3 Ants learn to rely on more informative attributes during decision-making
- 9.4 Multi-variate models are essential for understanding vertebrate diversification in deep time
- 9.5 What do didgeridoos really do about sleepiness?
- 9.6 General summary
- References
5.14 Practice problems
Determine which type of test is appropriate in each situation – Independence or Homogeneity?
5.1. Concerns over diseases being transmitted between birds and humans have led to many areas developing monitoring plans for the birds that are in their regions. The duck pond on campus at MSU-Bozeman is a bit like a night club for the birds that pass through Bozeman.
Suppose that a researcher randomly samples 20 ducks at the duck pond on campus on 4 different occasions and records the number ducks that are healthy and number that are sick on each day. The variables in this study are the day of measurement and sick/healthy.
In another monitoring study, a researcher goes to a wetland area and collects a random sample from all birds present on a single day, classifies them by type of bird (ducks, swans, etc.) and then assesses whether each is sick or healthy. The variables in this study are type of bird and sick/healthy.
5.2. Psychologists performed an experiment on 48 male bank supervisors attending a management institute to investigate biases against women in personnel decisions. The supervisors were asked to make a decision on whether to promote a hypothetical applicant based on a personnel file. For half of them, the application file described a female candidate; for the others it described a male.
5.3. Researchers collected data on death penalty sentencing in Georgia. For 243 crimes, they categorized the crime by severity from 1 to 6 with Category 1 comprising barroom brawls, liquor-induced arguments, lovers’ quarrels, and similar crimes and Category 6 including the most vicious, cruel, cold-blooded, unprovoked crimes. They also recorded the perpetrator’s race. They wanted to know if there was a relationship between race and type of crime.
5.4. Epidemiologists want to see if Vitamin C helped people with colds. They would like to give some patients Vitamin C and some a placebo then compare the two groups. However, they are worried that the placebo might not be working. Since vitamin C has such a distinct taste, they are worried the participants will know which group they are in. To test if the placebo was working, they collected 200 subjects and randomly assigned half to take a placebo and the other half to take Vitamin C. 30 minutes later, they asked the subjects which supplement they received (hoping that the patients would not know which group they were assigned to).
5.5. Is zodiac sign related to GPA? 300 randomly selected students from MSU were asked their birthday and their current GPA. GPA was then categorized as < 1.50 = F, 1.51-2.50 = D, 2.51 - 3.25 = C, 3.26-3.75 = B, 3.76-4.0 = A and their birthday was used to find their zodiac sign.
5.6. In 1935, the statistician R. A. Fisher famously had a colleague claim that she could distinguish whether milk or tea was added to a cup first. Fisher presented her, in a random order, 4 cups that were filled with milk first and 4 cups that were filled with tea first.
5.7. Researchers wanted to see if people from Rural and Urban areas aged differently. They contacted 200 people from Rural areas and 200 people from Urban areas and asked the participants their age (<40, 41-50, 51-60, >60).
The FiveThirtyEight Blog often shows up with interesting data summaries that have general public appeal. Their staff includes a bunch of quants with various backgrounds. When starting their blog, they had to decide on the data is/are question that we introduced in Section 2.1. To help them think about this, they collected a nationally representative sample that contained three questions about this. Based on their survey, they concluded that
Relevant to the interests of FiveThirtyEight in particular, we also asked whether people preferred using “data” as a singular or plural noun. To those who prefer the plural, I’ll put this in your terms: The data are pretty conclusive that the vast majority of respondents think we should say “data is.” The singular crowd won by a 58 percentage-point margin, with 79 percent of respondents liking “data is” to 21 percent preferring “data are.” But only half of respondents had put any thought to the usage prior to our survey, so it seems that it’s not a pressing issue for most.
This came from a survey that contained questions about which is the
correct usage, (isare), have you thought about this issue
(thoughtabout) with levels Yes/No, and do you care about this issue
(careabout) with four levels from Not at all to A lot. The following
code loads their data set after missing responses were removed, does a
little re-ordering of factor levels to help make the results easier to
understand, and makes a tableplot (Figure 2.98) to get a general sense of the results
including information on the respondents’ gender, age, income, and education.
library(readr)
csd <- read_csv("http://www.math.montana.edu/courses/s217/documents/csd.csv")
library(tabplot)
#Need to make it explicit that these are factor variables
csd$careabout <- factor(csd$careabout)
#Reorders factor levels to be in "correct" order
csd$careabout <- factor(csd$careabout,
                    levels=levels(csd$careabout)[c(1,4,3,2)])
csd$Education <- factor(csd$Education)
csd$Education <- factor(csd$Education,
                    levels=levels(csd$Education)[c(4,3,5,1,2)])
csd$Household.Income <- factor(csd$Household.Income)
csd$Household.Income <- factor(csd$Household.Income,
                    levels=levels(csd$Household.Income)[c(1,4,5,6,2,3)])
#Sorts plot by careabout responses
tableplot(csd[,c("isare","careabout","thoughtabout","Gender",
                 "Age","Household.Income","Education")], sortCol=careabout,
pals=list("BrBG")) 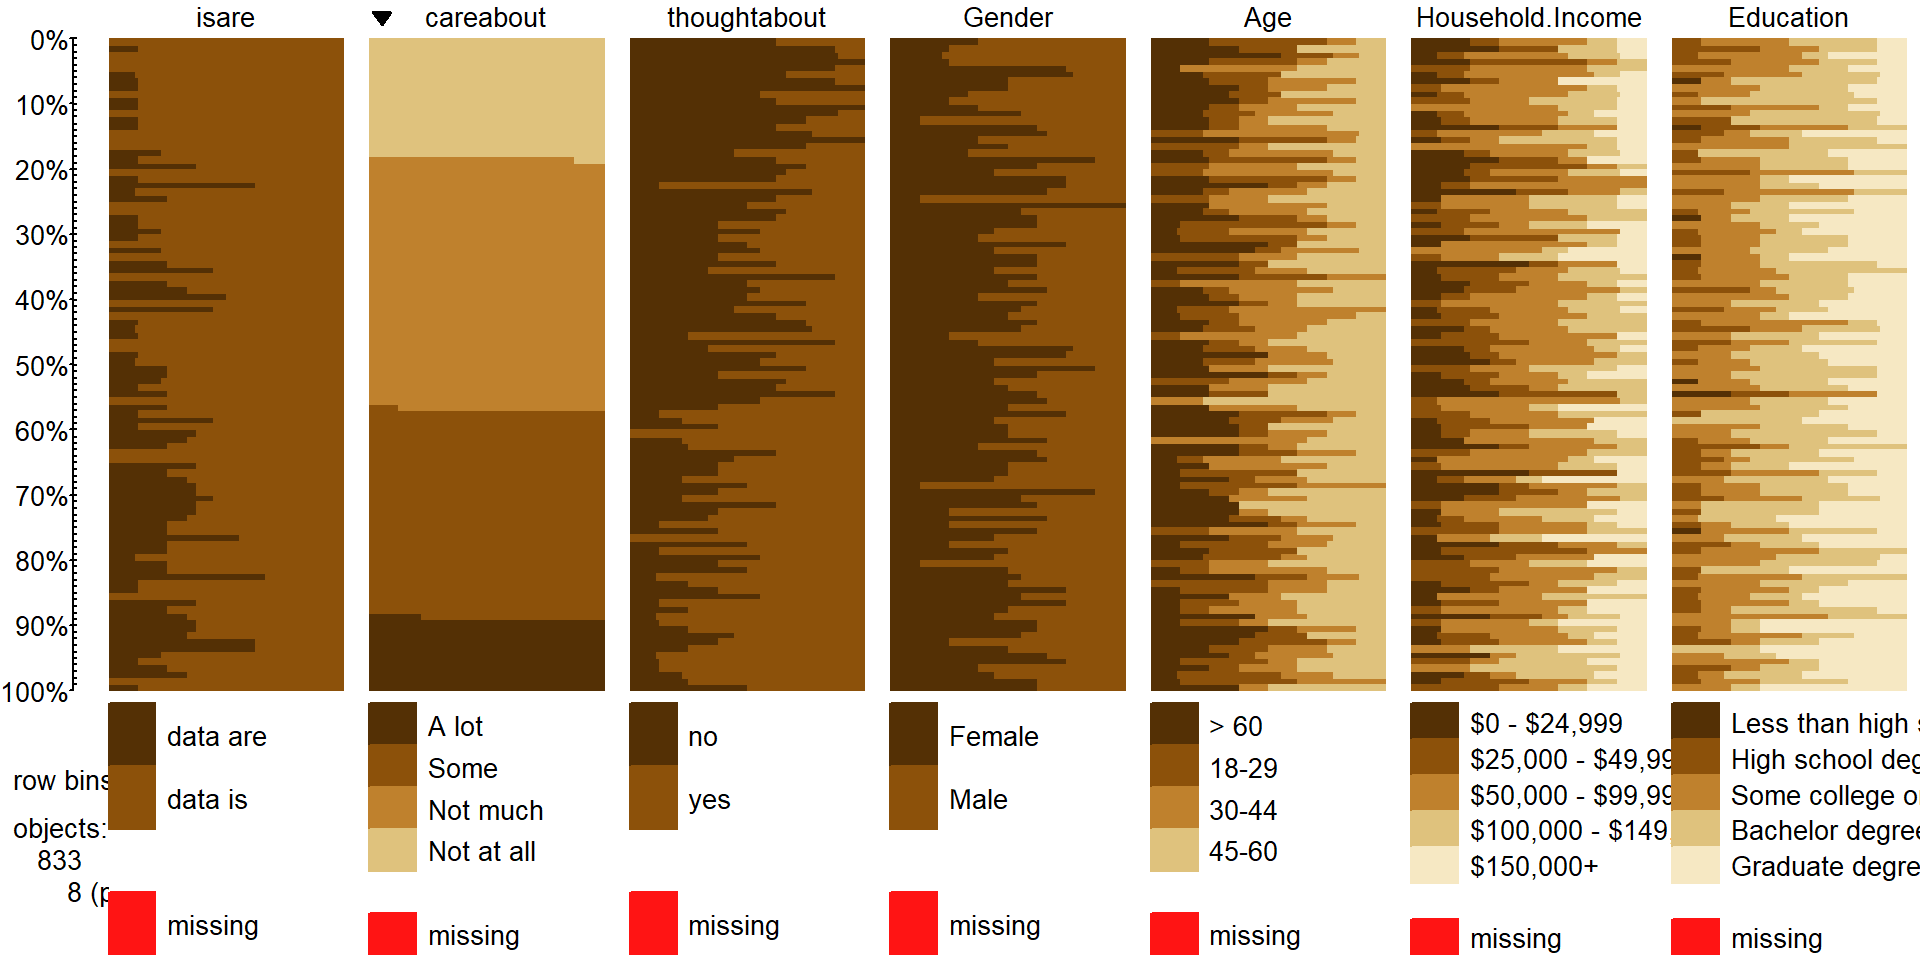
Figure 2.98: Tableplot of data from “data-is-vs-data-are” survey, sorted by “CareAbout” responses.
5.8. If we are interested in the variables isare and careabout,
what sort of test should we perform?
5.9. Make the appropriate plot of the results for the table relating those two variables relative to your answer to 5.8.
5.10. Generate the contingency table and find the expected cell counts, first “by hand” and then check them using the output. Is the parametric procedure appropriate here? Why or why not?
5.11. Report the value of the test statistic, its distribution under the null, the parametric p-value, and write a decision and conclusion, making sure to address scope of inference.
5.12. Make a mosaic plot with the standardized residuals and discuss the results. Specifically, in what way do the is/are preferences move away from the null hypothesis for people that care more about this?
| We might be fighting a losing battle on “data is a plural word”, but since we |
| are in the group that cares a lot about this, we are going to keep trying… |
We can revisit the car overtake passing distance data from Chapter ?? and to focus in on the “close calls”. The following code uses the ifelse function to create the close call/not response variable. It works to create a two-category variable where the first category (close) is encountered when the condition is true (dd$Distance<=100, so the passing distance was less than or equal to 100 cm) from the “if” part of the function (if Distance is less than or equal to 100 cm, then “close”) and the “else” is the second category (when the Distance was over 100 cm) and gets the category of notclose. The factor function is applied to the results from ifelse to make this a categorical variable for later use. Some useful code and a stacked bar-chat in Figure 2.99 is provided.
dd <- read_csv("http://www.math.montana.edu/courses/s217/documents/Walker2014_mod.csv")
dd$Condition <- factor(dd$Condition)
dd$Condition2 <- with(dd, reorder(Condition, Distance, mean))
dd$Close <- factor(ifelse(dd$Distance<=100, "close", "notclose"))

plot(Close ~ Condition2, data=dd)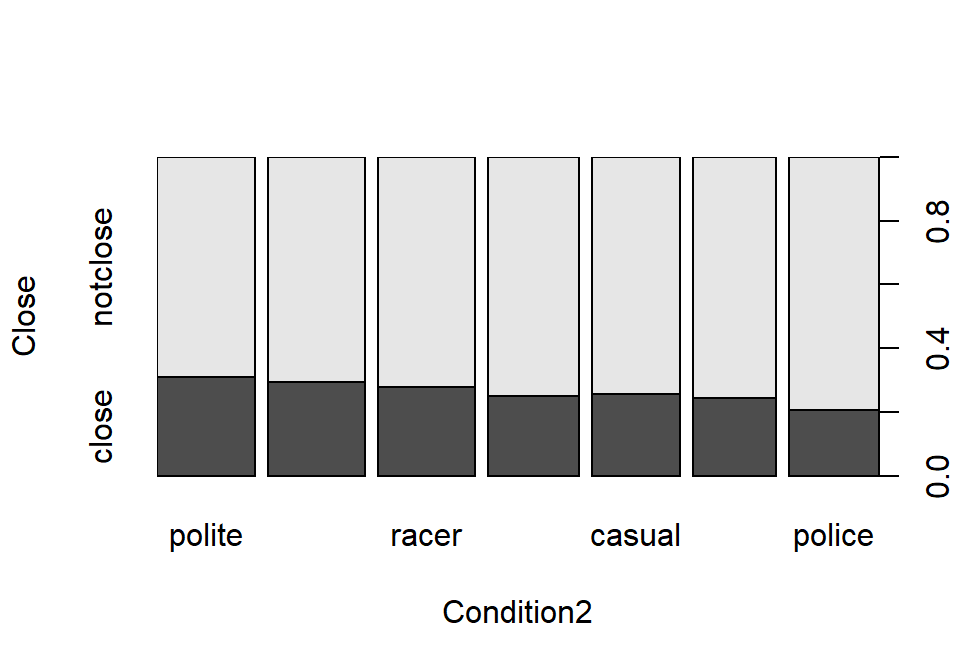
Figure 2.99: Stacked bar-chart of the close calls/not (overtakes less than or equal to 100 cm or not) by outfit.
##
##  Pearson's Chi-squared test
##
## data:  table1
## X-squared = 30.861, df = 6, p-value = 2.695e-05
5.13. This is a Homogeneity test situation. Why?
5.14. Perform the 6+ steps of the hypothesis test using the provided results.
5.15. Explain how these results are consistent with the One-Way ANOVA test but also address a different research question.